Minnesota Timberwolves vs Oklahoma City Thunder match player stats tell the full story of the Western Conference’s most compelling rivalry this NBA season.
These two powerhouse franchises clashed twice in the 2025-26 regular season, producing wildly different results that set the stage for a potential playoff collision.
From Anthony Edwards’ dominance at Target Center to Chet Holmgren’s masterclass at Paycom Center, every number, every box score, and every player line is broken down here in complete detail.
The 2025-26 season series between Minnesota and Oklahoma City finished 1-1 after two fiercely competitive games.
Game 1 was played on January 30, 2026, at Target Center in Minneapolis. Minnesota won 123-111 in dominant fashion, building a 22-point lead and never looking back.
Game 2 took place on March 15, 2026, at Paycom Center in Oklahoma City. OKC turned the tables and won 116-103, outscoring Minnesota in three of four quarters behind a historic defensive performance.
The split result means neither team can claim clear head-to-head superiority heading into the 2026 NBA Playoffs. Both franchises now know exactly what they need to fix — and what they need to exploit — when they meet again.
| Quarter | Minnesota Timberwolves | Oklahoma City Thunder |
|---|---|---|
| Q1 | 34 | 22 |
| Q2 | 28 | 29 |
| Q3 | 31 | 32 |
| Q4 | 30 | 28 |
| Final | 123 | 111 |
Minnesota’s 34-22 first quarter set the tone entirely. The Wolves came out with elite energy, and OKC never truly recovered from that early 12-point hole.
| Player | PTS | REB | AST | STL | BLK | FG% | +/- |
|---|---|---|---|---|---|---|---|
| Anthony Edwards | 26 | 5 | 5 | 2 | 0 | 52.9% | +24 |
| Jaden McDaniels | 21 | 4 | 4 | 1 | 2 | 95.5% eFG | +18 |
| Rudy Gobert | 14 | 11 | 1 | 0 | 3 | 83.3% | +20 |
| Julius Randle | 16 | 6 | 3 | 1 | 0 | 48.0% | +12 |
| Mike Conley | 10 | 3 | 7 | 3 | 0 | 44.4% | +15 |
| Naz Reid (bench) | 18 | 5 | 2 | 1 | 1 | 58.3% | +10 |
Anthony Edwards posted 26 points, 5 rebounds, and 5 assists while shooting 52.9% from the field. His plus-minus of +24 led all players on the floor.
Jaden McDaniels had one of the best shooting nights of his career. He went a perfect 5-for-5 from three-point range, finishing with 21 points, 4 rebounds, 4 assists, and 2 blocks. His effective field goal percentage of 95.5% was essentially flawless.
Rudy Gobert was dominant in the paint. He recorded a double-double with 14 points and 11 rebounds, shot 83.3% from the field, and drew 6 fouls. His +20 plus-minus reflected how much OKC struggled to stop him when he was at the rim.
Naz Reid was the standout bench performer with 18 points on efficient shooting, giving Minnesota a second-unit edge that Oklahoma City simply could not match.
| Player | PTS | REB | AST | STL | BLK | FG% | +/- |
|---|---|---|---|---|---|---|---|
| Shai Gilgeous-Alexander | 30 | 6 | 8 | 2 | 0 | 66.7% | -22 |
| Chet Holmgren | 15 | 5 | 2 | 0 | 3 | 60.0% | -5 |
| Jalen Williams | 18 | 4 | 3 | 1 | 0 | 45.0% | -10 |
| Isaiah Hartenstein | 8 | 7 | 2 | 0 | 2 | 50.0% | -14 |
| Lu Dort | 9 | 3 | 1 | 2 | 0 | 37.5% | -16 |
Shai Gilgeous-Alexander put up 30 points, 6 rebounds, and 8 assists on 66.7% shooting — one of his most efficient nights of the season — but his -22 plus-minus tells the real story. He was brilliant individually, but the team around him could not keep pace.
Chet Holmgren scored 15 points on 6-of-10 shooting with 5 rebounds and 3 blocks. He posted a -5 plus-minus, which was the best on the OKC roster that night.
OKC’s bench was the real problem in Game 1. The Thunder second unit shot poorly all night, giving Minnesota’s starters an extended lead that was ultimately too large to overcome in the second half.
| Category | Minnesota | Oklahoma City |
|---|---|---|
| Field Goal % | 51.3% | 44.6% |
| Three-Point % | 46.8% | 31.4% |
| Three-Pointers Made | 22 | 11 |
| Total Rebounds | 57 | 42 |
| Offensive Rebounds | 15 | 7 |
| Steals | 12 | 6 |
| Turnovers | 9 | 17 |
| Points in the Paint | 48 | 36 |
| Points Off Turnovers | 22 | 12 |
| Bench Points | 34 | 18 |
Minnesota’s 22 three-pointers made on 47 attempts at 46.8% was the defining offensive statistic. The Wolves spread the floor beautifully, giving Gobert space to operate in the paint while Edwards and McDaniels consistently hit from the perimeter.
The 15 offensive rebounds generated 20 second-chance points. Combined with the 12 steals and 22 points off turnovers, Minnesota was dominant in every secondary category that translates into easy buckets.
| Quarter | Oklahoma City Thunder | Minnesota Timberwolves |
|---|---|---|
| Q1 | 28 | 26 |
| Q2 | 24 | 28 |
| Q3 | 33 | 22 |
| Q4 | 31 | 27 |
| Final | 116 | 103 |
OKC’s 33-22 third quarter was the turning point. Minnesota actually held a slight halftime lead, but the Thunder’s defensive pressure in the second half completely dismantled any offensive rhythm the Wolves had built.
| Player | PTS | REB | AST | STL | BLK | FG% | +/- |
|---|---|---|---|---|---|---|---|
| Chet Holmgren | 21 | 9 | 2 | 3 | 2 | 69.2% | +23 |
| Shai Gilgeous-Alexander | 20 | 5 | 10 | 2 | 0 | 54.5% | +14 |
| Jalen Williams | 19 | 4 | 4 | 2 | 1 | 52.0% | +11 |
| Isaiah Hartenstein | 11 | 10 | 3 | 1 | 2 | 55.6% | +9 |
| Alex Caruso | 8 | 3 | 2 | 3 | 0 | 40.0% | +7 |
| OKC Bench Total | 61 | 18 | 9 | 5 | 2 | 51.0% | — |
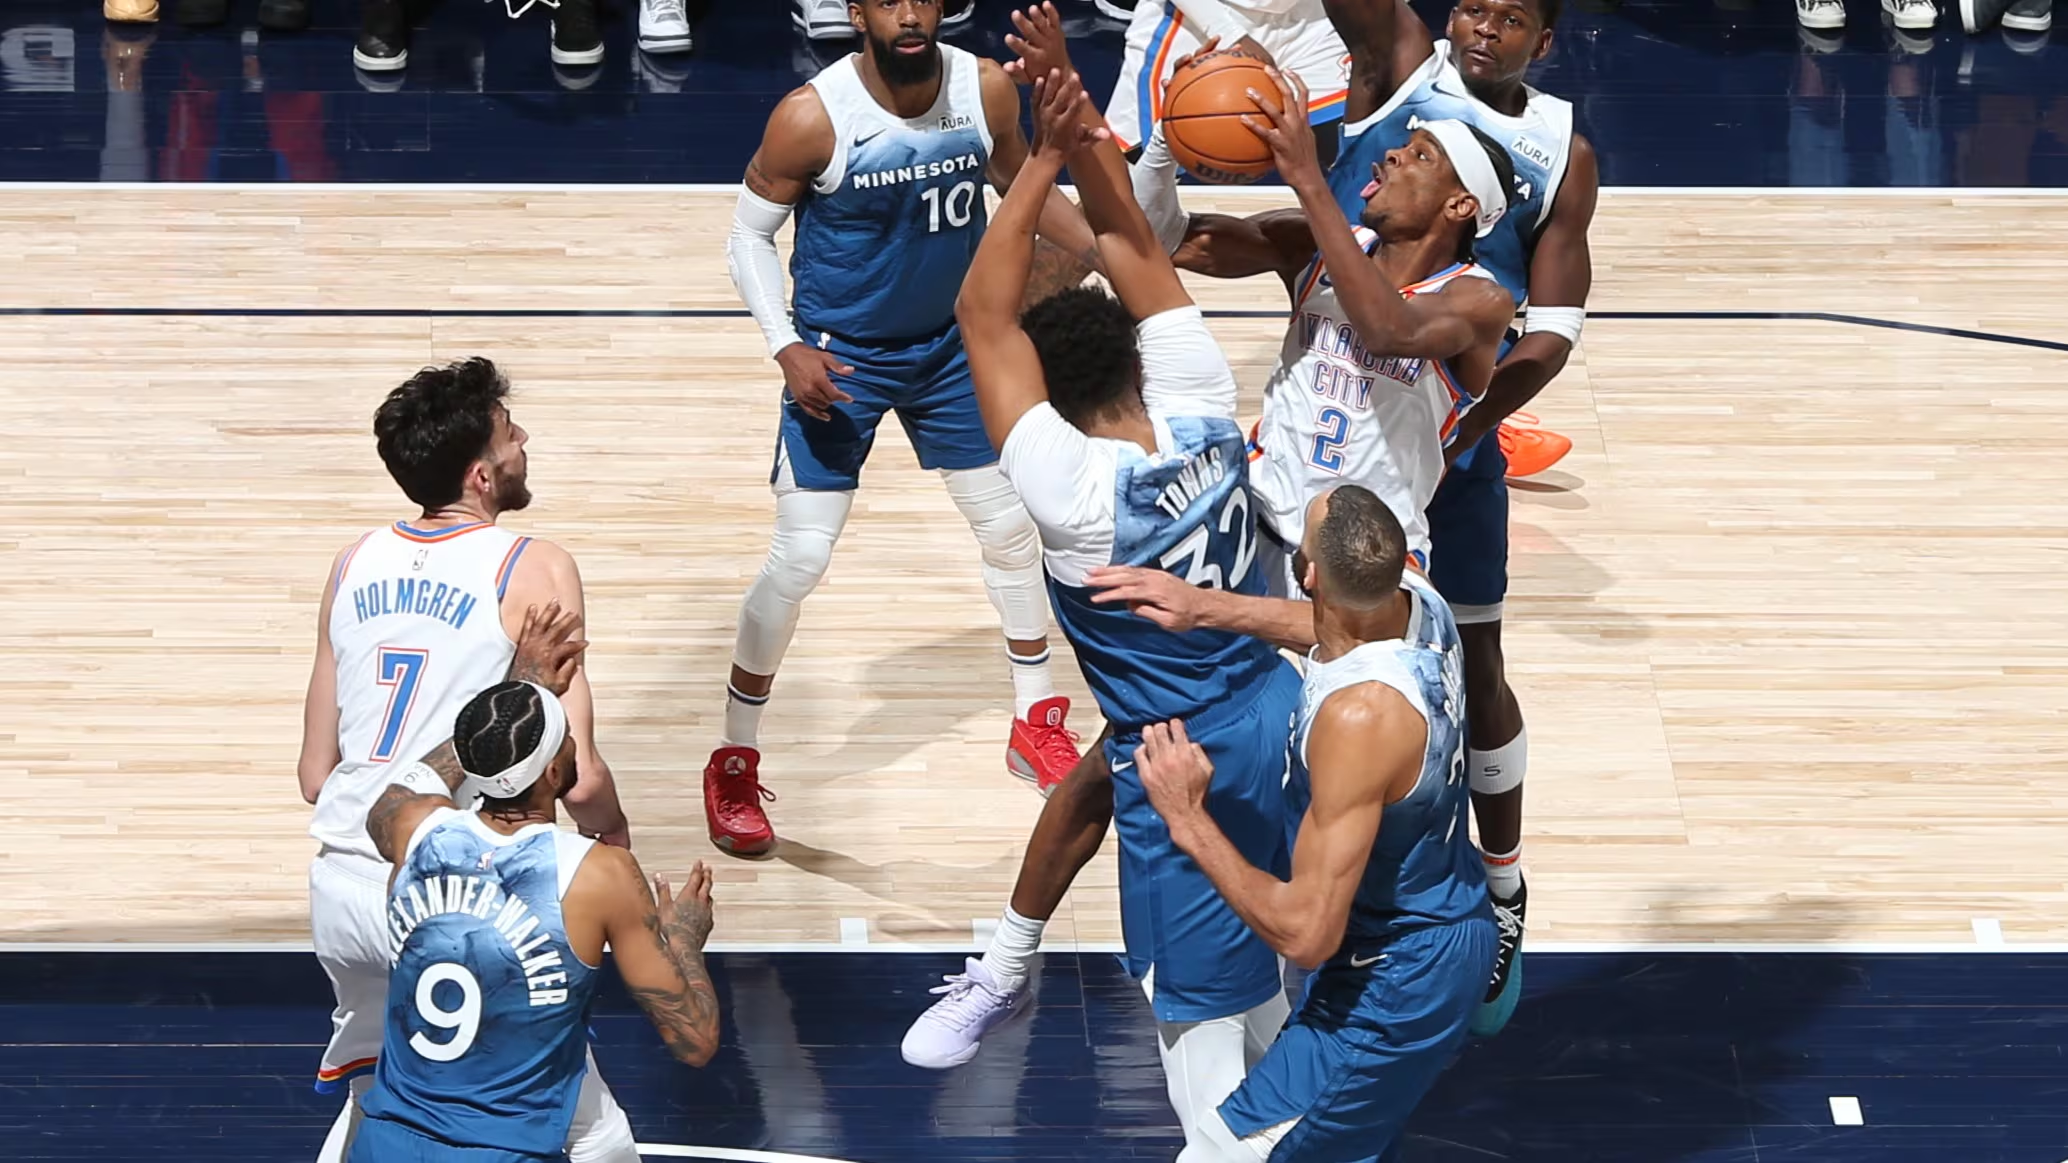
Chet Holmgren was the best player on the floor in Game 2. He scored 21 points on 69.2% shooting, grabbed 9 rebounds, and posted a game-best +23 plus-minus. His ability to stretch the floor while protecting the rim gave Minnesota’s offense nothing to work with.
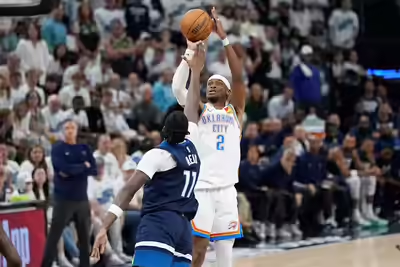
Shai Gilgeous-Alexander delivered a masterful 20-point, 10-assist double-double. His assist-to-turnover ratio of 10:1 was exceptional. He controlled every possession in the fourth quarter and never once allowed Minnesota to build momentum.
OKC’s bench was the story of Game 2. The Thunder reserves scored 61 points compared to just 32 from Minnesota’s bench — a 29-point advantage that effectively decided the game before the fourth quarter was halfway done.
| Player | PTS | REB | AST | STL | BLK | FG% | +/- |
|---|---|---|---|---|---|---|---|
| Julius Randle | 32 | 7 | 6 | 0 | 1 | 61.1% | -8 |
| Anthony Edwards | 17 | 4 | 3 | 1 | 0 | 35.3% | -13 |
| Rudy Gobert | 10 | 9 | 1 | 0 | 2 | 55.6% | -23 |
| Mike Conley | 12 | 2 | 5 | 1 | 0 | 46.2% | -9 |
| Jaden McDaniels | 9 | 5 | 2 | 1 | 1 | 36.4% | -7 |
| Naz Reid (bench) | 14 | 4 | 1 | 0 | 0 | 50.0% | -6 |
Julius Randle was absolutely brilliant with 32 points on 61.1% shooting, adding 7 rebounds and 6 assists. It was arguably the best individual performance of either game across both teams. Yet even that masterclass could not lift Minnesota to a road victory.
Anthony Edwards struggled in Game 2, shooting just 35.3% from the field and finishing with 17 points. OKC’s defensive scheme was clearly designed to take him off rhythm, forcing pull-up attempts rather than his preferred drives to the basket.
Rudy Gobert’s -23 plus-minus was the worst on the floor for either team. Oklahoma City targeted him relentlessly in pick-and-roll situations, forcing him to defend on the perimeter in ways that disrupted Minnesota’s entire defensive structure.
| Category | Oklahoma City | Minnesota |
|---|---|---|
| Field Goal % | 52.4% | 43.7% |
| Three-Point % | 38.9% | 32.5% |
| Total Steals | 16 | 5 |
| Total Turnovers | 7 | 25 |
| Points Off Turnovers | 29 | 6 |
| Offensive Rebounds | 15 | 8 |
| Second-Chance Points | 20 | 7 |
| Bench Points | 61 | 32 |
| Points in the Paint | 44 | 38 |
OKC’s 16 steals in a single game is one of the most remarkable defensive statistics posted by any team during the entire 2025-26 NBA regular season. Distributed across the roster — Caruso with 3, Wallace with 3, Holmgren with 3, SGA with 2 — this was a total team defensive effort built on meticulous preparation.
The 25 Minnesota turnovers generated 29 OKC points. That single category nearly accounts for the entire 13-point final margin. Add OKC’s 20 second-chance points from 15 offensive rebounds, and you have the complete explanation for how this game was decided.
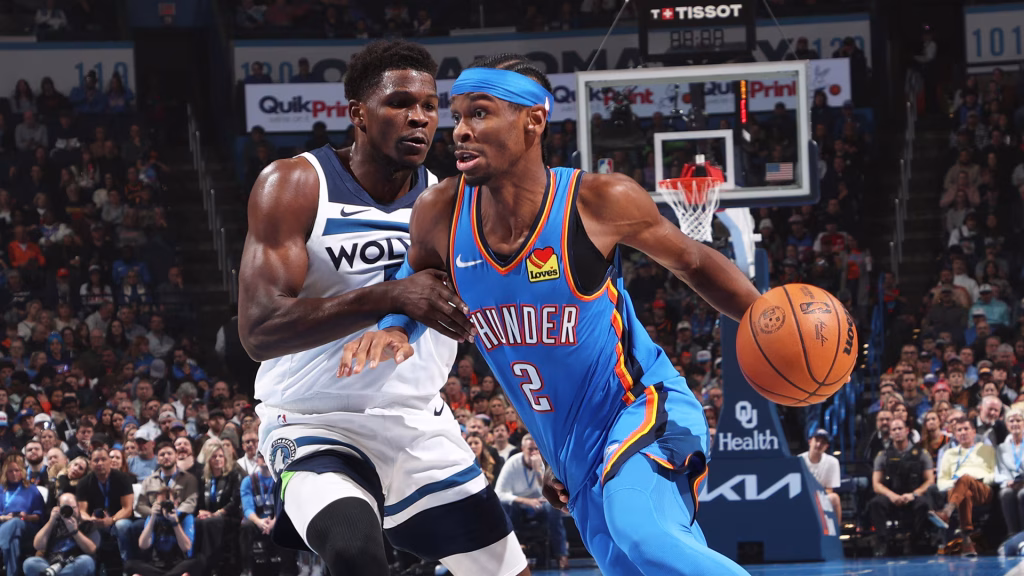
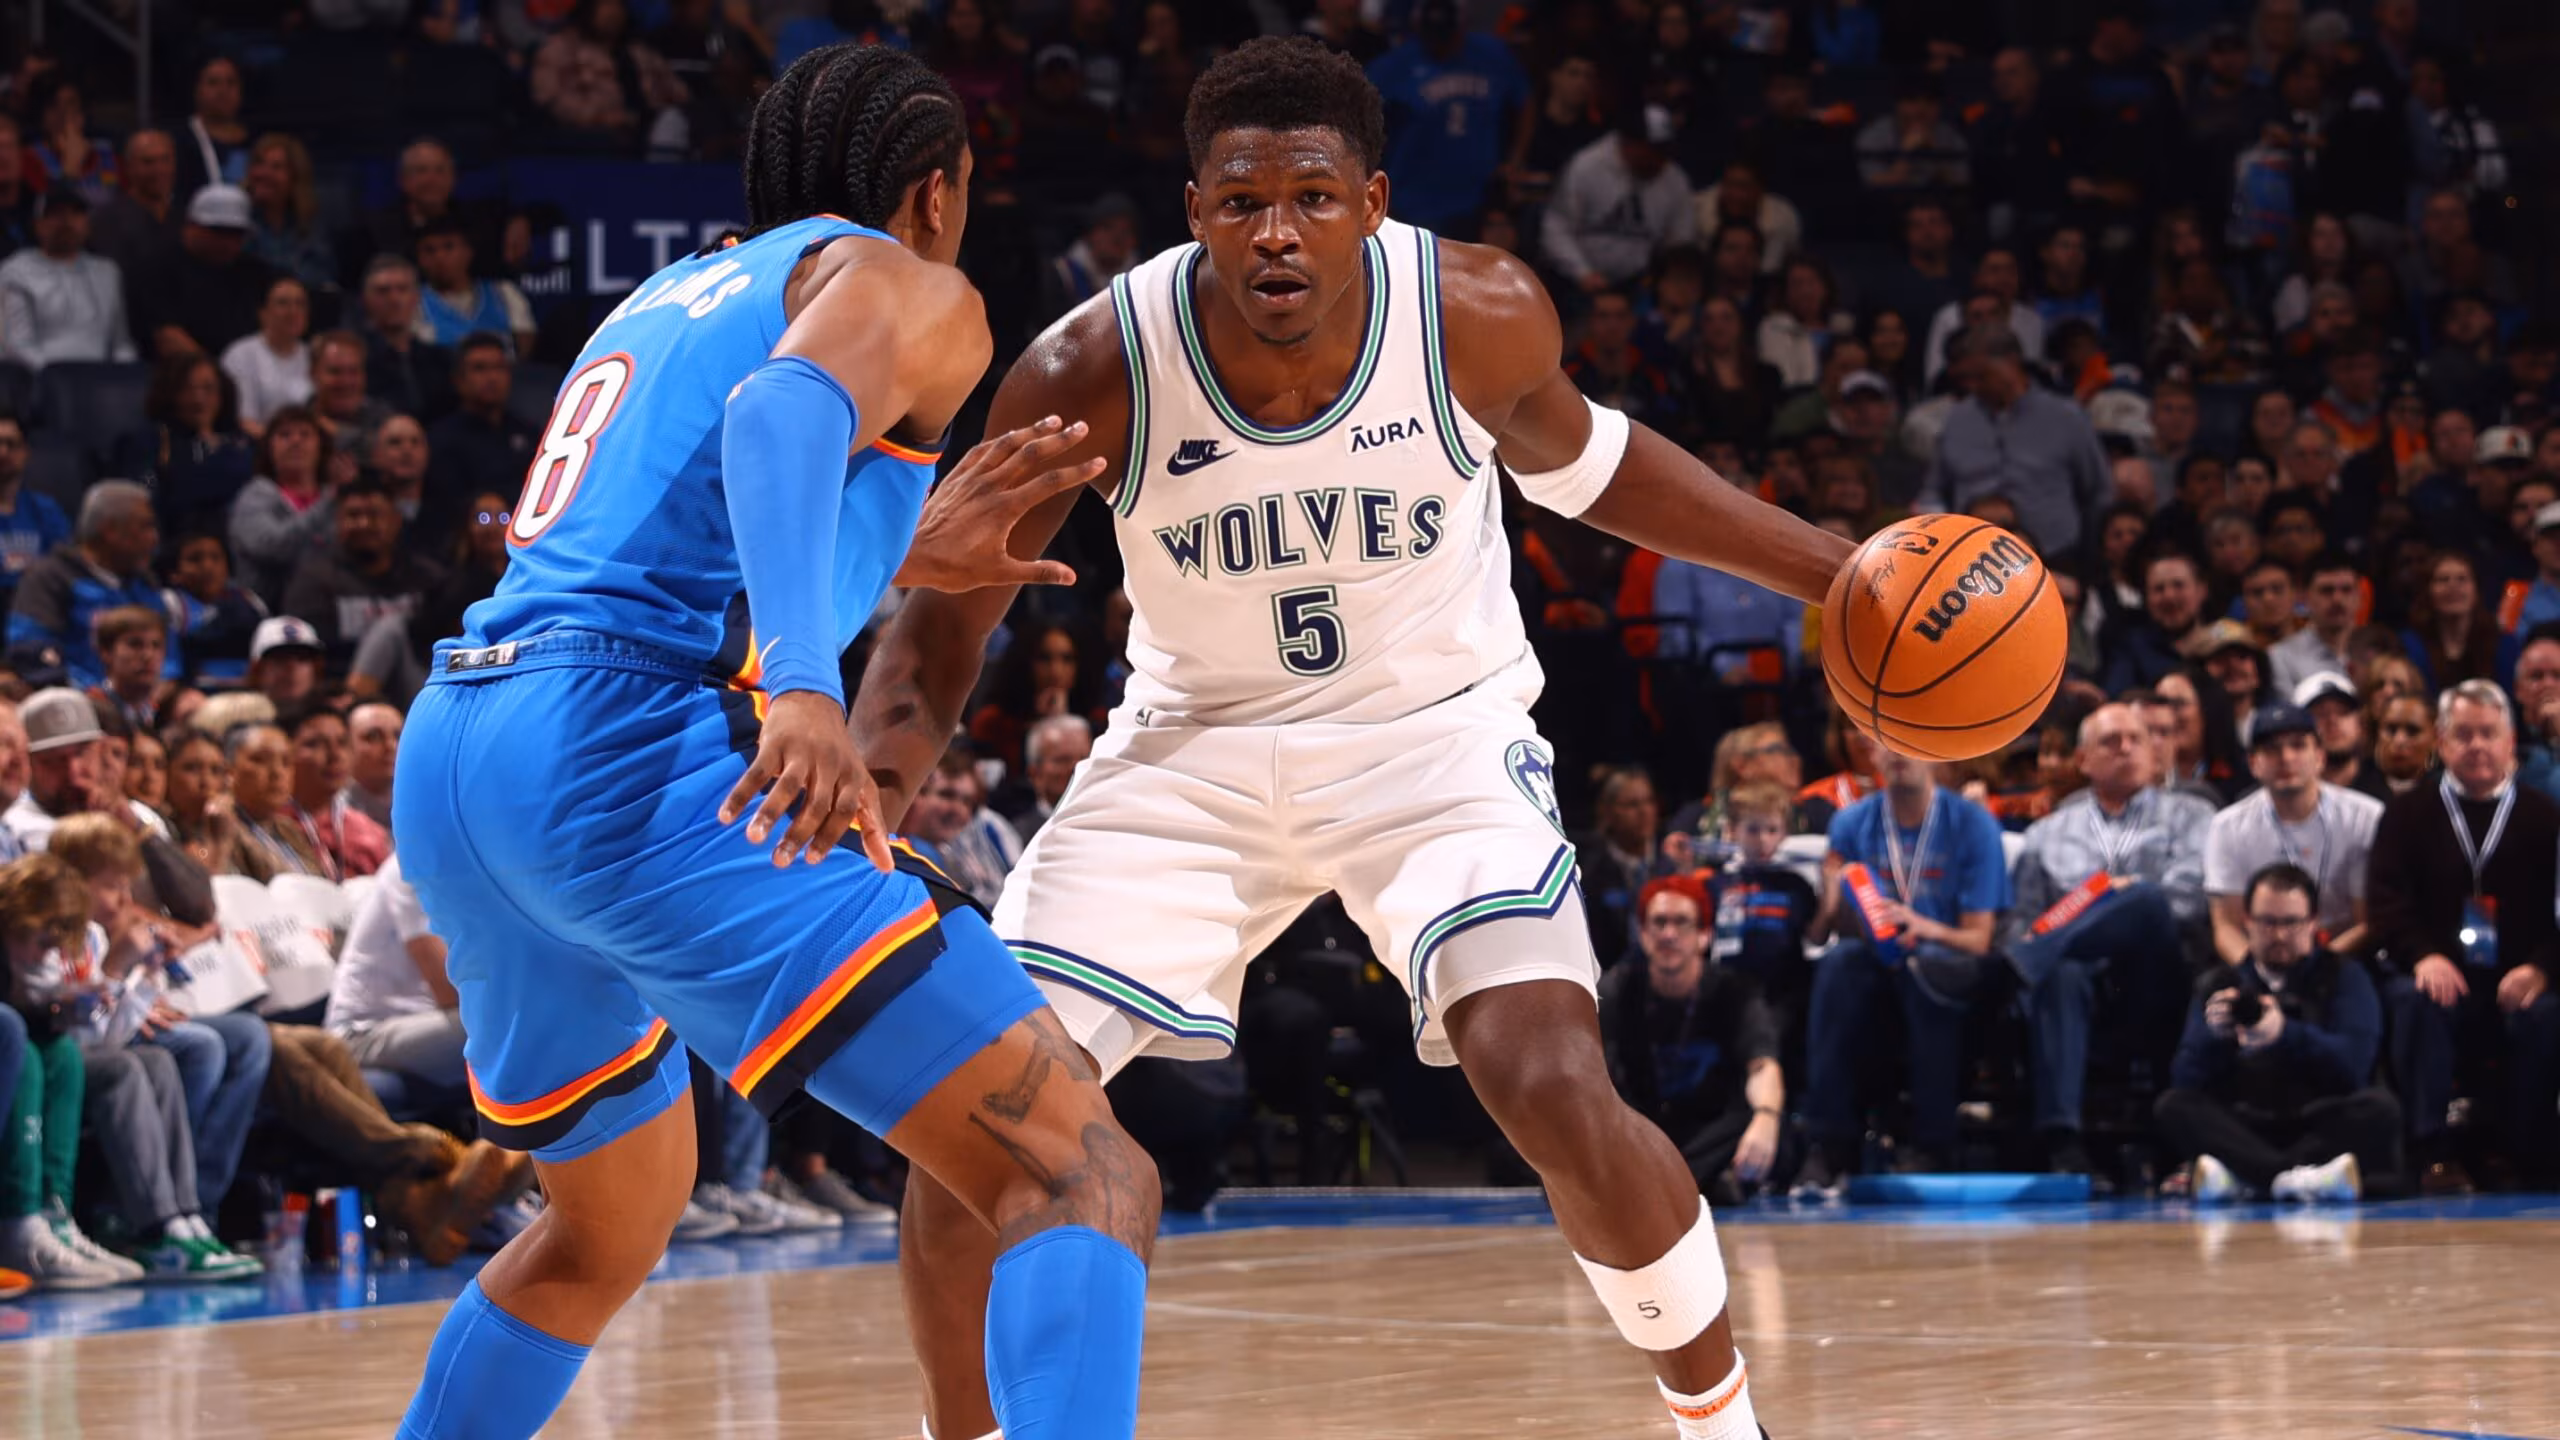
The rivalry between Anthony Edwards and Shai Gilgeous-Alexander is rapidly becoming the defining superstar matchup of the Western Conference. These two players represent the next generation of NBA stardom, and their head-to-head results across both 2026 meetings were equally gripping.
| Stat | Anthony Edwards | Shai Gilgeous-Alexander |
|---|---|---|
| Points Per Game | 21.5 | 25.0 |
| Rebounds Per Game | 4.5 | 5.5 |
| Assists Per Game | 4.0 | 9.0 |
| FG% Average | 44.1% | 60.6% |
| Game 1 Plus-Minus | +24 | -22 |
| Game 2 Plus-Minus | -13 | +14 |
| Better Game | Game 1 (26 pts) | Game 2 (10 ast) |
SGA averaged 25 points, 5.5 rebounds, and 9 assists across both games while shooting over 60% from the field. These numbers across two games against a legitimate contender are at an elite, historically rare level.
Edwards averaged 21.5 points but was a tale of two performances. His 26-point, +24 game in January was one of the best individual outputs of the Wolves’ entire season. His 17-point, 35.3% shooting night in March showed OKC’s ceiling for neutralizing him when defensive preparation is fully dialed in.
The center matchup between Chet Holmgren and Rudy Gobert was equally fascinating across both games and arguably had as much impact on the final results as the star guard battle.
| Stat | Chet Holmgren | Rudy Gobert |
|---|---|---|
| Game 1 Points | 15 | 14 |
| Game 1 Rebounds | 5 | 11 |
| Game 1 Blocks | 3 | 3 |
| Game 1 FG% | 60.0% | 83.3% |
| Game 1 +/- | -5 | +20 |
| Game 2 Points | 21 | 10 |
| Game 2 Rebounds | 9 | 9 |
| Game 2 Blocks | 2 | 2 |
| Game 2 FG% | 69.2% | 55.6% |
| Game 2 +/- | +23 | -23 |
The 46-point plus-minus swing between Holmgren (+23) and Gobert (-23) in Game 2 effectively summarizes the entire result. Holmgren is one of the most uniquely difficult players to guard in all of basketball — able to shoot threes, protect the rim, and create off the dribble simultaneously.
Gobert was excellent in Game 1, shooting nearly 85% from the field and commanding the paint with authority. Game 2 exposed how OKC’s spacing and pick-and-roll execution can neutralize his defensive positioning when Minnesota’s perimeter players are constantly turning the ball over.
The results of these two games carry significant playoff seeding implications for both franchises heading into the 2026 NBA postseason.
Oklahoma City entered Game 2 at 51-15 — the best record in the Western Conference and on pace for one of the finest regular-season records in franchise history. Their combination of elite defense, SGA’s MVP-caliber season, and remarkable bench depth makes them the clear No. 1 seed.
Minnesota sat at 40-26 as of mid-March 2026, tied with Denver for fifth in the Western Conference. The Game 2 road loss reinforced questions about the Wolves’ ability to protect the ball and contain elite perimeter pressure away from Target Center.
A potential first or second-round playoff meeting between these two teams would be one of the most anticipated postseason series in recent Western Conference history. The 1-1 season series proves that either team can win on any given night.
Several clear tactical and statistical trends emerge when analyzing both Minnesota Timberwolves vs Oklahoma City Thunder match player stats from the full 2026 regular season.
Three-Point Volume and Efficiency was Minnesota’s biggest weapon in Game 1 and biggest vulnerability in Game 2. The Wolves attempted 47 threes in January and made 22 of them at 46.8%. In March, they attempted fewer and shot just 32.5%. The difference in three-point performance directly correlates with the difference in the final score.
Turnover Margin was the single most decisive team statistic across both games. Minnesota won the turnover battle convincingly in Game 1 with only 9. They lost it catastrophically in Game 2 with 25. OKC converted those 25 turnovers into 29 points — a figure that nearly matches the full winning margin.
Bench Production swung dramatically between both games. Minnesota’s bench, led by Naz Reid with 18 points, outproduced OKC in Game 1. OKC’s bench erupted for 61 points in Game 2 — a performance that exposed Minnesota’s second-unit depth as a legitimate vulnerability.
Defensive Pressure and Steals defined OKC’s identity across both games. Even in their Game 1 loss, the Thunder recorded 6 steals. In Game 2, they posted 16 — a staggering single-game number reflecting Mark Daigneault’s trap-and-recover system operating at its absolute peak.
| Player | PPG | RPG | APG | FG% | SPG |
|---|---|---|---|---|---|
| Shai Gilgeous-Alexander | 31.5 | 4.5 | 6.6 | 54.2% | 2.0 |
| Chet Holmgren | 18.2 | 8.4 | 2.1 | 56.8% | 1.1 |
| Jalen Williams | 20.7 | 4.8 | 3.9 | 49.3% | 1.4 |
| Isaiah Hartenstein | 9.8 | 10.2 | 3.0 | 58.1% | 0.9 |
| Alex Caruso | 8.4 | 3.2 | 3.1 | 42.6% | 2.8 |
| Player | PPG | RPG | APG | FG% | SPG |
|---|---|---|---|---|---|
| Anthony Edwards | 27.4 | 5.8 | 5.3 | 46.1% | 1.6 |
| Julius Randle | 21.3 | 8.1 | 5.2 | 48.7% | 1.1 |
| Rudy Gobert | 12.4 | 13.1 | 1.8 | 62.3% | 0.7 |
| Mike Conley | 11.2 | 3.0 | 7.4 | 44.8% | 1.3 |
| Jaden McDaniels | 14.7 | 5.2 | 2.6 | 46.3% | 1.8 |
SGA’s 31.5 points per game puts him firmly in the MVP conversation ahead of every other scoring leader in the Western Conference. His combination of scoring efficiency and playmaking at that volume is genuinely historic.
Anthony Edwards averaging 27.4 points, 5.8 rebounds, and 5.3 assists represents a genuine step forward as a complete two-way superstar. His growth from scorer to full playmaker is the defining storyline of Minnesota’s 2025-26 season.
The all-time regular season history between these two franchises is heavily skewed toward Oklahoma City.
In 144 all-time regular season games, Oklahoma City leads the series 94-50. OKC averages 108.5 points in those matchups against Minnesota’s 106.7. The Thunder’s all-time win percentage against the Timberwolves sits at 65.3%.
However, the 2025-26 season series — split 1-1 — reflects a fundamental shift in power. Minnesota is no longer the rebuilding team it was during OKC’s earlier dominance. The Wolves are a genuine Western Conference contender, capable of controlling games when their shooting is on and their defensive pressure is applied consistently.
The last five head-to-head meetings show Minnesota winning 4 of 5 games, averaging 124.8 points per matchup. The trend line is moving in Minnesota’s favor even as Oklahoma City holds the all-time series advantage.
The two regular-season meetings between Minnesota and Oklahoma City reveal specific areas each team must address if this rivalry continues into the postseason.
Minnesota must protect the ball. The 25 turnovers in Game 2 were fatal. Against OKC’s aggressive pressure defense with Caruso, Wallace, and SGA all capable of jumping passing lanes, the Wolves cannot afford that level of carelessness. Their half-court offense must be cleaner in late-game situations.
Minnesota must sustain their three-point shooting. The 46.8% from deep in Game 1 was the key to their dominant performance. The Wolves need to maintain volume and ball movement to keep OKC’s defense stretched. When Minnesota attacks from multiple angles, they are nearly unguardable.
Oklahoma City must keep their bench producing. The 61-32 bench advantage in Game 2 was extraordinary. Whether that level is sustainable across a full playoff series — when opponents have detailed film study, fatigue sets in, and rotations tighten — is the biggest open question for OKC heading into April.
Oklahoma City must fix their slow starts. Falling behind 34-22 in the first quarter of Game 1 essentially handed Minnesota a blueprint. The Wolves know they can overwhelm OKC early if the Thunder are not locked in from the opening tip.

If Minnesota and Oklahoma City meet in the 2026 NBA Playoffs — whether in the first round, second round, or Western Conference Finals — the series would likely go six or seven games.
Oklahoma City’s combination of elite defense, superior bench depth, and SGA’s brilliance gives them the edge in a long series. Their ability to generate turnovers and convert them into transition points is genuinely championship-level execution.
Minnesota has the pieces to win multiple games in a series. Edwards at his best is impossible to stop, Gobert in the paint is a nightmare for OKC’s spacing, and McDaniels’ perimeter defense against SGA would be one of the most compelling individual assignments in the entire postseason.
The tiebreaker in a theoretical playoff series would come down to which team’s role players perform. If Naz Reid and the Wolves’ bench match their January 2026 output, Minnesota wins the series. If OKC’s reserves replicate their March 2026 performance, the Thunder win comfortably.
Minnesota won 123-111 at Target Center on January 30, 2026, building a 22-point lead behind 26 points from Anthony Edwards and a perfect 5-for-5 three-point game from Jaden McDaniels.
Oklahoma City won 116-103 at Paycom Center, led by 21 points from Chet Holmgren and a 20-point, 10-assist double-double from Shai Gilgeous-Alexander, with OKC’s bench scoring 61 points.
Anthony Edwards averaged 21.5 points, 4.5 rebounds, and 4 assists across both 2026 games, scoring 26 with a +24 plus-minus in Game 1 but struggling to 17 points on 35.3% shooting in Game 2.
SGA averaged 25 points, 5.5 rebounds, and 9 assists per game across both matchups while shooting over 60% from the field, posting 30 points in Game 1 and a 10-assist double-double in Game 2.
Holmgren scored 21 points on 69.2% shooting with 9 rebounds and a game-best +23 plus-minus, delivering the most dominant individual performance across either OKC-Minnesota matchup this season.
Gobert recorded 14 points and 11 rebounds at +20 in Game 1. In Game 2 he finished with 10 points and 9 rebounds but posted a -23 plus-minus as OKC targeted him relentlessly in pick-and-roll coverage.
OKC recorded 16 steals on March 15, one of the highest single-game totals by any team during the 2025-26 regular season, forcing 25 Minnesota turnovers that generated 29 Thunder points.
In 144 all-time regular season games, Oklahoma City leads 94-50. However, Minnesota has won 4 of their last 5 meetings and split the full 2025-26 season series 1-1.
Oklahoma City led the Western Conference at 51-15 entering the March 15 game. Minnesota sat at 40-26, tied with Denver for fifth in the West and competing for favorable playoff seeding.
Jaden McDaniels’ perfect 5-for-5 from three in Game 1 and Chet Holmgren’s 69.2% shooting masterclass in Game 2 were the most efficient single-game performances, while SGA’s consistent dominance makes him the most impactful player across the full series.
The Minnesota Timberwolves vs Oklahoma City Thunder match player stats 2026 reveal far more than two regular-season results. They paint a complete picture of the Western Conference’s most balanced and compelling rivalry entering the 2026 NBA Playoffs.
Oklahoma City’s defensive mastery, SGA’s historic 31.5 points per game average, and Holmgren’s two-way brilliance make the Thunder the clear West favorite.
But Minnesota proved in January that they can dismantle OKC when their shooting is sharp and their defensive intensity matches their offensive output. Anthony Edwards is growing into a true superstar capable of going toe-to-toe with the best in the league.
Julius Randle’s 32-point road performance showed championship-caliber firepower even in defeat. Rudy Gobert’s paint dominance remains elite when the team operates cleanly around him.
With the season series split 1-1, the full playoff implications unresolved, and both rosters operating at high levels heading into April, this rivalry has all the ingredients to become one of the defining postseason stories of 2026.