Timberwolves vs Golden State Warriors match player stats in 2026 delivered one of the most compelling back-to-back series of the NBA season.
Minnesota and Golden State faced off twice in four days in late January — the Warriors dominated Game 1 and the Timberwolves answered with a massive blowout win in Game 2.
The two teams met at Target Center on January 25 and January 27, 2026 — two games with wildly different outcomes.
In Game 1, Golden State came in and dominated, winning 111–85 behind a season-high 20 steals and unstoppable fast break offense. Two nights later in Game 2, Minnesota flipped the script entirely, crushing the Warriors 108–83 with 29 fast break points and a suffocating defensive performance.
The split means the season series between these teams remains alive heading into their next scheduled meeting on March 14, 2026 at Chase Center.
| Game | Date | Location | Winner | Score | Margin |
|---|---|---|---|---|---|
| Game 1 | Jan 25, 2026 | Target Center (MIN) | Golden State Warriors | 111–85 | 26 pts |
| Game 2 | Jan 27, 2026 | Target Center (MIN) | Minnesota Timberwolves | 108–83 | 25 pts |
Both games were decided by 25+ points, making this one of the most volatility-heavy head-to-head series in the Western Conference this season.
The Warriors came into Target Center and delivered a clinic.
Golden State jumped out to a 24–19 lead after the first quarter and held their advantage throughout. The third quarter was the dagger — the Warriors outscored Minnesota 38–17 in a 10-minute stretch that broke the game wide open.
The Warriors’ 20 steals were a remarkable defensive accomplishment — nearly double the league average. That forced-turnover machine generated 25 points off turnovers, swinging the effective margin enormously.
| Quarter | Timberwolves | Warriors |
|---|---|---|
| Q1 | 19 | 24 |
| Q2 | 27 | 23 |
| Q3 | 17 | 38 |
| Q4 | 22 | 26 |
| Final | 85 | 111 |
Minnesota briefly led after the second quarter but the Warriors’ explosive third quarter — 38 points — was completely unmanageable.
| Stat | Timberwolves | Warriors |
|---|---|---|
| Field Goal % | 38.0% | 42.1% |
| 3-Point % | 34.2% | 31.4% |
| Free Throw % | 60.0% | 93.8% |
| Total Rebounds | 59 | 55 |
| Assists | 16 | 31 |
| Steals | 6 | 20 |
| Blocks | 5 | 5 |
| Turnovers | 26 | 12 |
| Points in Paint | 24 | 46 |
| Fast Break Points | 14 | 22 |
| Bench Points | 13 | 42 |
| Points Off Turnovers | 13 | 25 |
| Offensive Rating | 81.9 | 102.7 |
| Defensive Rating | 102.7 | 81.9 |
| True Shooting % | 48.4% | 54.4% |
| Effective FG % | 46.2% | 50.5% |
| Biggest Lead | 2 | 26 |
The Warriors’ 20 steals versus Minnesota’s 6 tells the full story of Game 1. Golden State turned defense into offense relentlessly — 22 fast break points and 25 points off turnovers completely overwhelmed a Timberwolves team that coughed up 26 turnovers.
Edwards was the lone bright spot for Minnesota in Game 1.
He posted 32 points on an outstanding 65.0% shooting, adding 11 rebounds and 2 assists for a double-double. His 57.1% three-point shooting (4-of-7) and 75.0% true shooting percentage showed he was doing everything possible to keep Minnesota competitive.
Despite those individual numbers, Edwards finished at -16 plus/minus — a reflection of how badly the team struggled around him.
DiVincenzo was the second-best Minnesota performer with 22 points, including 6-of-15 from three.
He added 7 rebounds and finished with a 55.3% true shooting percentage. His 5 turnovers, however, contributed to Minnesota’s catastrophic 26-turnover total that handed Golden State the game.
Curry was the Warriors’ engine in Game 1, finishing with 26 points, 7 assists, and 4 steals.
He shot 38.9% from the floor but hit 9-of-9 free throws and posted a 59.2% true shooting percentage. Curry’s 4 steals epitomized Golden State’s defensive approach — aggressive, disruptive, and relentless in the passing lanes. His +16 plus/minus was the best among Warriors starters.
Moody was arguably Golden State’s most complete player in Game 1.
He scored 19 points on 46.7% shooting and an elite 55.6% from three (5-of-9), added 8 rebounds, and generated 10 fast break points. His +13 plus/minus and 63.3% true shooting percentage made him the Warriors’ most efficient player on the night.
Podziemski delivered 12 points and 5 assists with 4 steals off the bench.
He constantly disrupted Minnesota’s ball movement and turned steals into fast break opportunities. His 100% fast break conversion rate (3-of-3) shows how dangerous he is in transition.
| Player | PTS | REB | AST | FG% | 3P% | STL | TO | +/- |
|---|---|---|---|---|---|---|---|---|
| Anthony Edwards | 32 | 11 | 2 | 65.0% | 57.1% | 0 | 8 | -16 |
| Donte DiVincenzo | 22 | 7 | 0 | 36.8% | 40.0% | 1 | 5 | -21 |
| Julius Randle | 11 | 5 | 6 | 27.3% | — | 3 | 1 | -15 |
| Rudy Gobert | 4 | 5 | 0 | 66.7% | — | 0 | 0 | -21 |
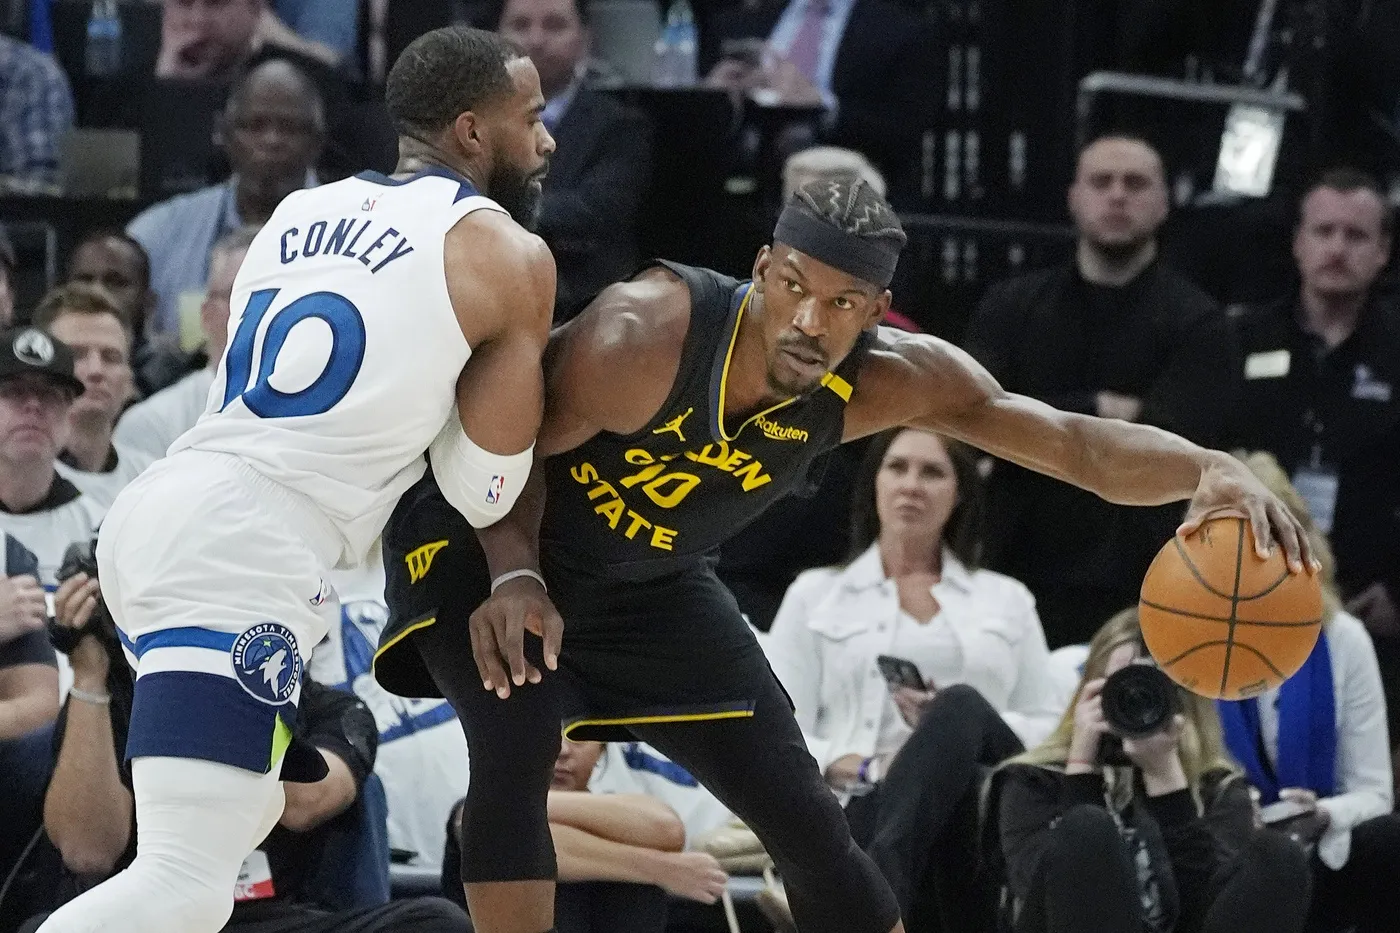
| Mike Conley | 2 | 3 | 1 | — | — | 1 | 1 | -14 |
| Naz Reid | 0 | 10 | 1 | — | — | 0 | 2 | -9 |
| Bones Hyland | 5 | 1 | 3 | 40.0% | — | 0 | 0 | +3 |
| Jaden McDaniels | 3 | 3 | 1 | 12.5% | 100% | 1 | 4 | -13 |
| Player | PTS | REB | AST | FG% | 3P% | STL | TO | +/- |
|---|---|---|---|---|---|---|---|---|
| Stephen Curry | 26 | 2 | 7 | 38.9% | 30.0% | 4 | 2 | +16 |
| Moses Moody | 19 | 8 | 2 | 46.7% | 55.6% | 0 | 1 | +13 |
| Brandin Podziemski | 12 | 5 | 6 | 60.0% | — | 4 | 2 | +16 |
| Al Horford | 10 | 5 | 2 | 57.1% | 40.0% | 1 | 0 | +7 |
| Will Richard | 10 | 2 | 1 | 44.4% | 40.0% | 3 | 1 | +7 |
| Gui Santos | 7 | 6 | 2 | 50.0% | 33.3% | 2 | 0 | +10 |
| Draymond Green | 2 | 5 | 5 | 20.0% | — | 2 | 1 | +14 |
| Buddy Hield | 4 | 2 | 0 | 40.0% | — | 0 | 1 | +11 |
Two days after being embarrassed at home, Minnesota came out with a completely different level of intensity.
The Timberwolves led 21–20 after the first quarter, then exploded in the second with a 32–18 scoring period that effectively ended the game. Minnesota’s defensive effort was relentless — 12 steals, 10 blocks, and a 76.3 defensive rating that is elite-tier by any NBA standard.
The biggest lead of 32 points tells you everything about how completely Minnesota controlled this game from start to finish.
| Quarter | Timberwolves | Warriors |
|---|---|---|
| Q1 | 21 | 20 |
| Q2 | 32 | 18 |
| Q3 | 22 | 19 |
| Q4 | 33 | 26 |
| Final | 108 | 83 |
Minnesota’s second quarter explosion — 32 points while holding Golden State to 18 — was the turning point that no comeback could overcome.
| Stat | Timberwolves | Warriors |
|---|---|---|
| Field Goal % | 45.7% | 34.7% |
| 3-Point % | 40.0% | 23.1% |
| Free Throw % | 76.9% | 61.5% |
| Total Rebounds | 61 | 57 |
| Assists | 29 | 21 |
| Steals | 12 | 13 |
| Blocks | 10 | 4 |
| Turnovers | 22 | 19 |
| Points in Paint | 42 | 44 |
| Fast Break Points | 29 | 17 |
| Bench Points | 44 | 27 |
| Points Off Turnovers | 23 | 19 |
| Offensive Rating | 102.4 | 76.3 |
| Defensive Rating | 76.3 | 102.4 |
| True Shooting % | 58.4% | 41.2% |
| Effective FG % | 54.3% | 39.5% |
| Biggest Lead | 32 | 8 |
Minnesota’s 10 blocks in Game 2 were a dominant defensive statement. Their 40.0% three-point shooting compared to Golden State’s 23.1% was another enormous gap. The Timberwolves’ bench also outscored the Warriors’ bench 44–27, reflecting a depth advantage Golden State simply couldn’t match.
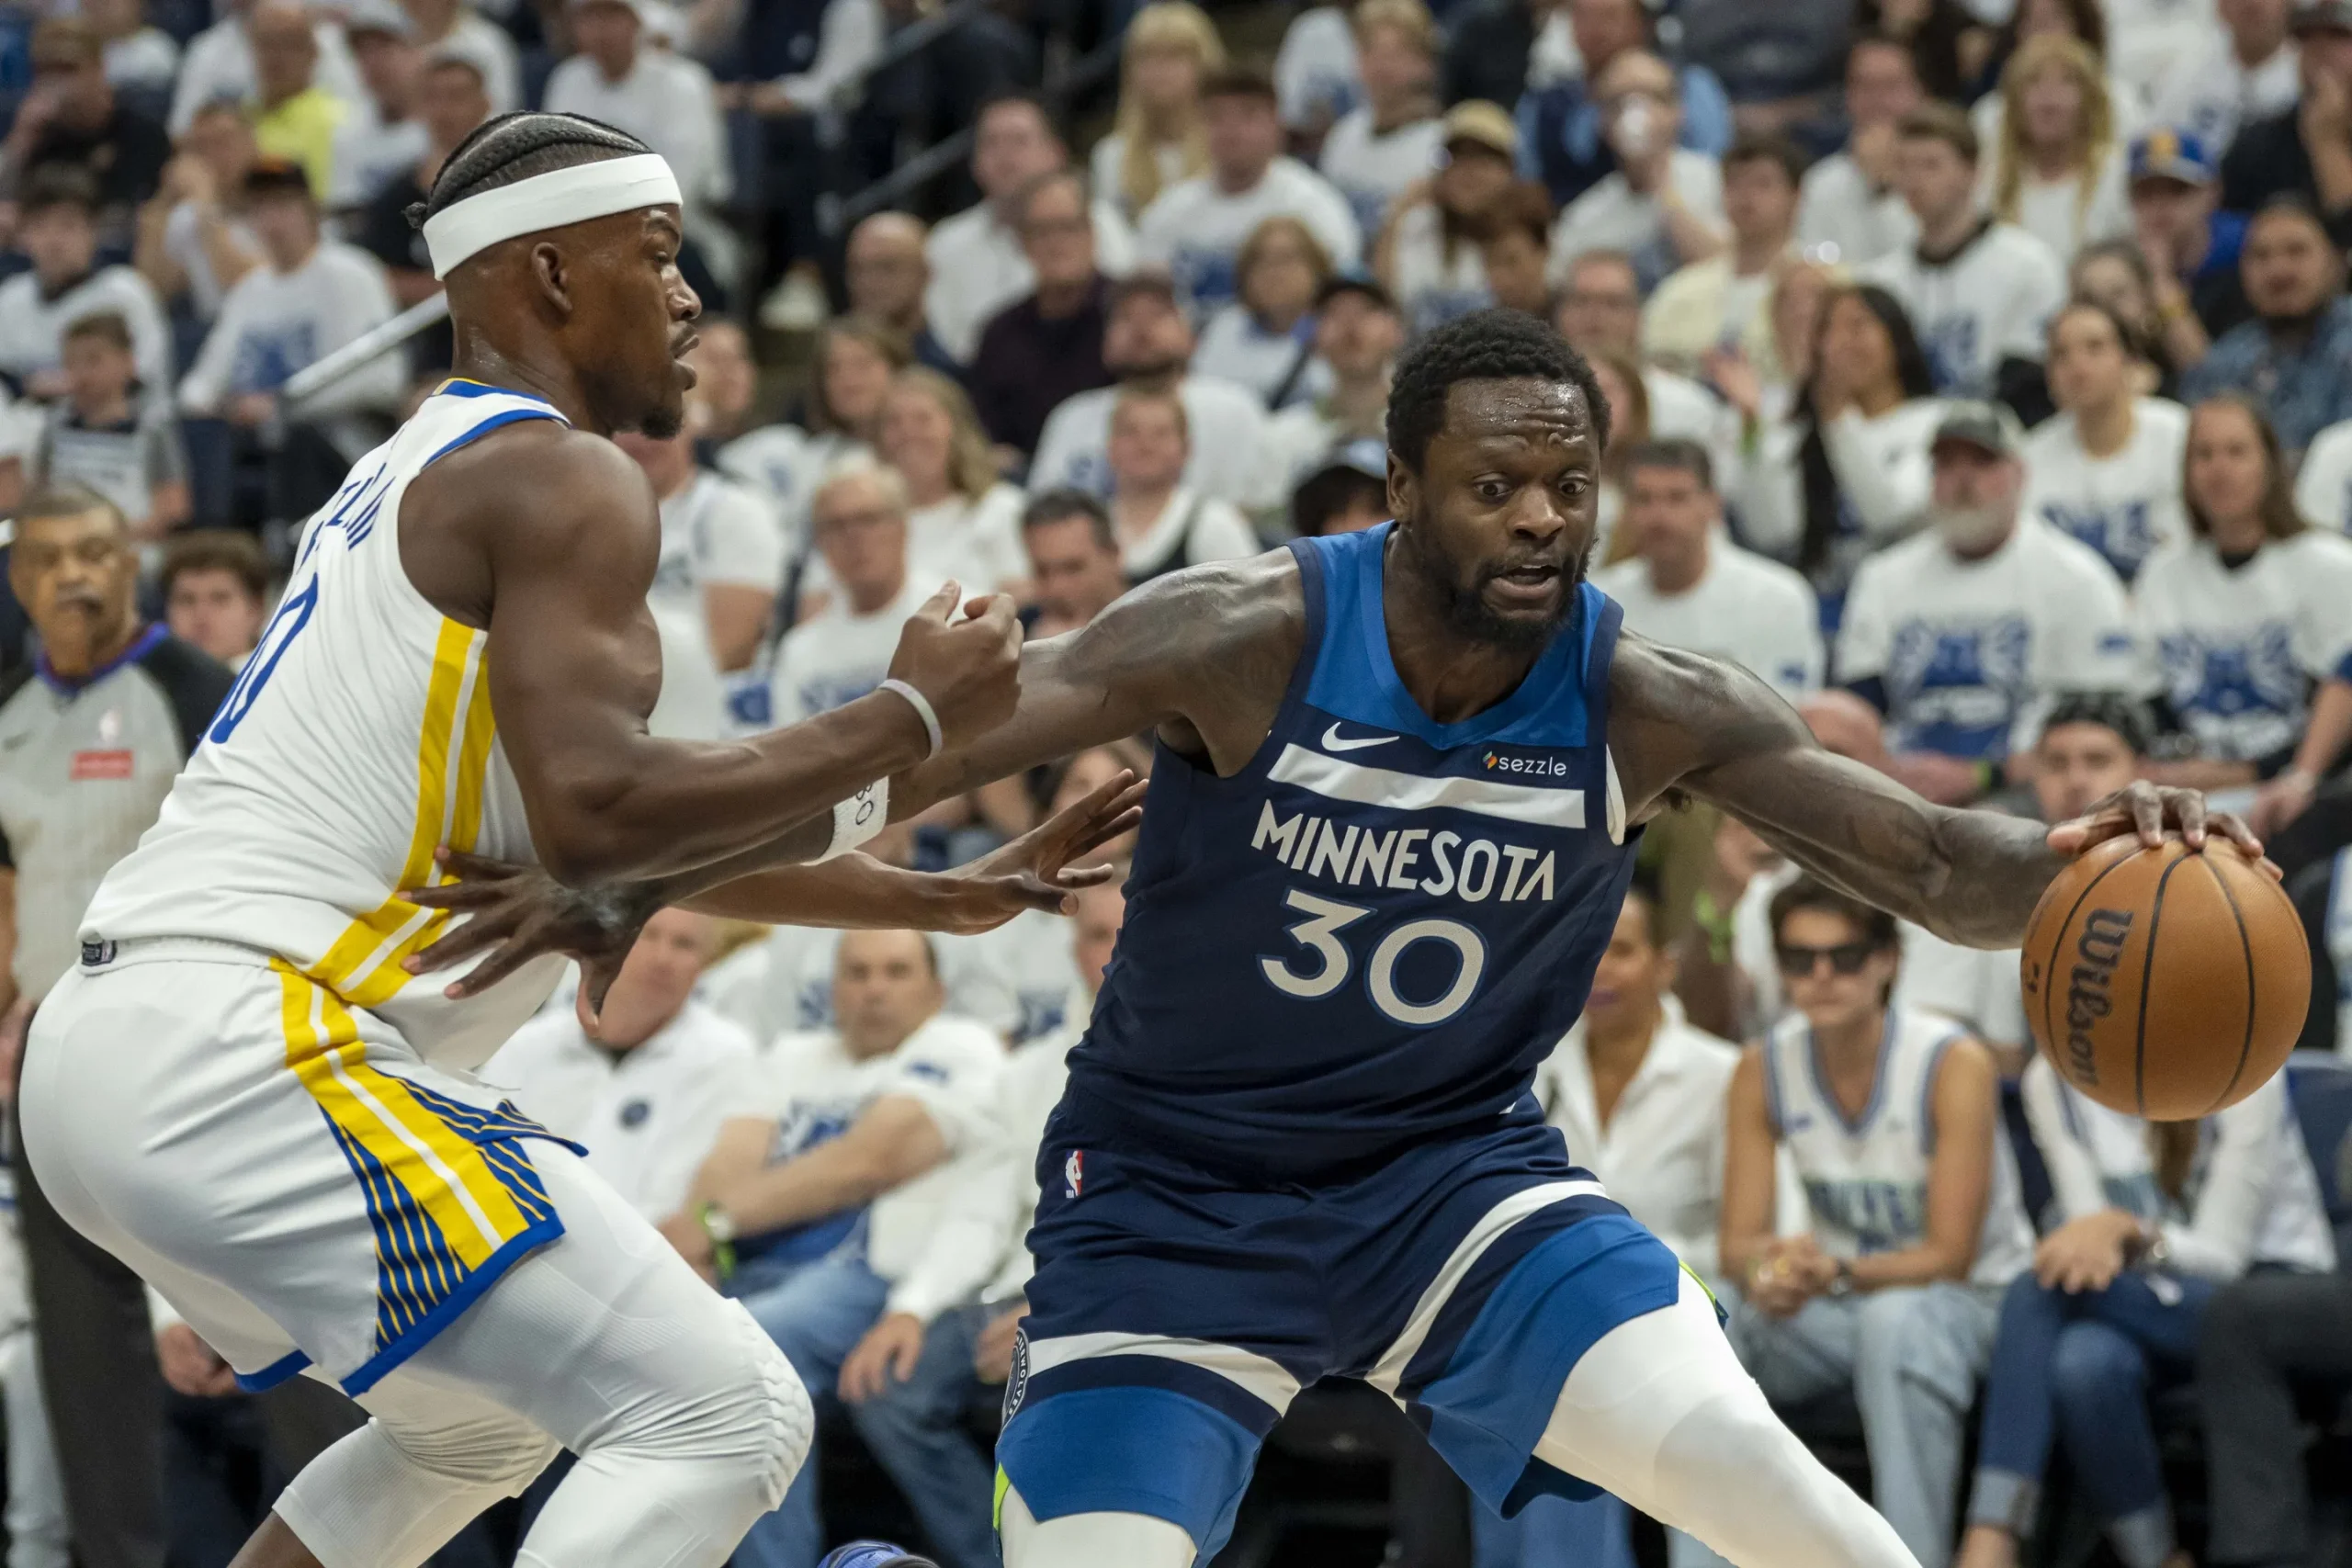
Randle was Minnesota’s steady contributor in Game 2 with 18 points on 46.7% shooting, 7 rebounds, and 2 assists.
He converted 75.0% of his paint attempts (6-of-8) and drew fouls consistently. His ability to punish the Warriors inside gave Minnesota a reliable mid-game scoring option when Golden State tried to slow the pace.
Hyland off the bench was spectacular in Game 2.
He posted 17 points on 66.7% shooting including 75% from three (3-of-4), adding 5 assists, 7 rebounds, and 9 fast break points. His +19 plus/minus was the best on the entire Timberwolves team and a 79.0% true shooting percentage was elite.
Reid had a standout performance with 15 points on 50% shooting, 7 rebounds, 3 assists, and 3 steals.
His +30 plus/minus led all players in Game 2 and was the best single-game plus/minus mark in this series. He shot 42.9% from three (3-of-7), showing stretch-5 range that created driving lanes for Edwards and Randle.
DiVincenzo bounced back from his turnover-heavy Game 1 with 15 points, 4 rebounds, and 8 assists in Game 2.
He shot 50% from the floor and 55.6% from three (5-of-9). His 3 blocks from the guard position were the kind of defensive play that elevates an entire team’s energy level.
McDaniels contributed a composed 14-point, 3-rebound, 3-assist, 3-block performance on 44.4% shooting.
He was a defensive anchor, using his length to alter shots and disrupt Golden State’s attacks at the rim. His +17 plus/minus in Game 2 was a massive improvement from his -13 in Game 1.
Santos was the only Warrior who put together a double-double effort in Game 2.
He posted 11 points with 10 rebounds on 5-of-13 shooting and contributed 5 fast break points. His -5 plus/minus was actually one of the better marks on a Warriors team that was getting outplayed at every position.
Post had a decent individual outing with 13 points on 41.7% shooting, 5 rebounds, and promising three-point production (42.9% on 7 attempts).
His 1 block showed defensive upside, but a -13 plus/minus reflected the team’s wider struggles throughout a difficult night in Minneapolis.
| Player | PTS | REB | AST | FG% | 3P% | STL | BLK | +/- |
|---|---|---|---|---|---|---|---|---|
| Julius Randle | 18 | 7 | 2 | 46.7% | 16.7% | 1 | 0 | +13 |
| Bones Hyland | 17 | 7 | 5 | 66.7% | 75.0% | 2 | 0 | +19 |
| Naz Reid | 15 | 7 | 3 | 50.0% | 42.9% | 3 | 1 | +30 |
| Donte DiVincenzo | 15 | 4 | 8 | 50.0% | 55.6% | 1 | 3 | +12 |
| Jaden McDaniels | 14 | 3 | 3 | 44.4% | 50.0% | 0 | 3 | +17 |
| Joan Beringer | 6 | 4 | 0 | 37.5% | — | 0 | 0 | -2 |
| Mike Conley | 2 | 2 | 2 | — | — | 0 | 1 | +11 |
| Jaylen Clark | 4 | 3 | 2 | 33.3% | — | 2 | 0 | +15 |
| Player | PTS | REB | AST | FG% | 3P% | STL | BLK | +/- |
|---|---|---|---|---|---|---|---|---|
| Quinten Post | 13 | 5 | 0 | 41.7% | 42.9% | 0 | 1 | -13 |
| Brandin Podziemski | 12 | 7 | 4 | 30.8% | — | 0 | 0 | -14 |
| Gui Santos | 11 | 10 | 2 | 38.5% | 16.7% | 1 | 1 | -5 |
| Moses Moody | 10 | 4 | 1 | 33.3% | 28.6% | 0 | 1 | -13 |
| Pat Spencer | 10 | 5 | 6 | 36.4% | 50.0% | 1 | 0 | -10 |
| Buddy Hield | 5 | 2 | 3 | 20.0% | 25.0% | 1 | 1 | -20 |
| Malevy Leons | 6 | 5 | 1 | 50.0% | — | 1 | 0 | -7 |
| Gary Payton II | 4 | 1 | 0 | 50.0% | — | 1 | 0 | -20 |
| Player | Team | G1 PTS | G2 PTS | Series Avg |
|---|---|---|---|---|
| Anthony Edwards | MIN | 32 | — | 32.0 |
| Donte DiVincenzo | MIN | 22 | 15 | 18.5 |
| Stephen Curry | GSW | 26 | — | 26.0 |
| Moses Moody | GSW | 19 | 10 | 14.5 |
| Julius Randle | MIN | 11 | 18 | 14.5 |
| Brandin Podziemski | GSW | 12 | 12 | 12.0 |
| Bones Hyland | MIN | 5 | 17 | 11.0 |
| Naz Reid | MIN | 0 | 15 | 7.5 |
| Player | Team | G1 REB | G2 REB | Total |
|---|---|---|---|---|
| Anthony Edwards | MIN | 11 | — | 11 |
| Naz Reid | MIN | 10 | 7 | 17 |
| Gui Santos | GSW | 6 | 10 | 16 |
| Moses Moody | GSW | 8 | 4 | 12 |
| Brandin Podziemski | GSW | 5 | 7 | 12 |
| Donte DiVincenzo | MIN | 7 | 4 | 11 |
| Metric | MIN G1 | GSW G1 | MIN G2 | GSW G2 |
|---|---|---|---|---|
| Offensive Rating | 81.9 | 102.7 | 102.4 | 76.3 |
| Defensive Rating | 102.7 | 81.9 | 76.3 | 102.4 |
| True Shooting % | 48.4% | 54.4% | 58.4% | 41.2% |
| Effective FG % | 46.2% | 50.5% | 54.3% | 39.5% |
| Turnovers | 26 | 12 | 22 | 19 |
| Points Off TOs | 13 | 25 | 23 | 19 |
| Bench Points | 13 | 42 | 44 | 27 |
| Fast Break Pts | 14 | 22 | 29 | 17 |
The swing in Minnesota’s defensive rating — from 102.7 in Game 1 to 76.3 in Game 2 — is a 26-point improvement that stands as one of the most dramatic single-game defensive turnarounds of the 2025-26 season.
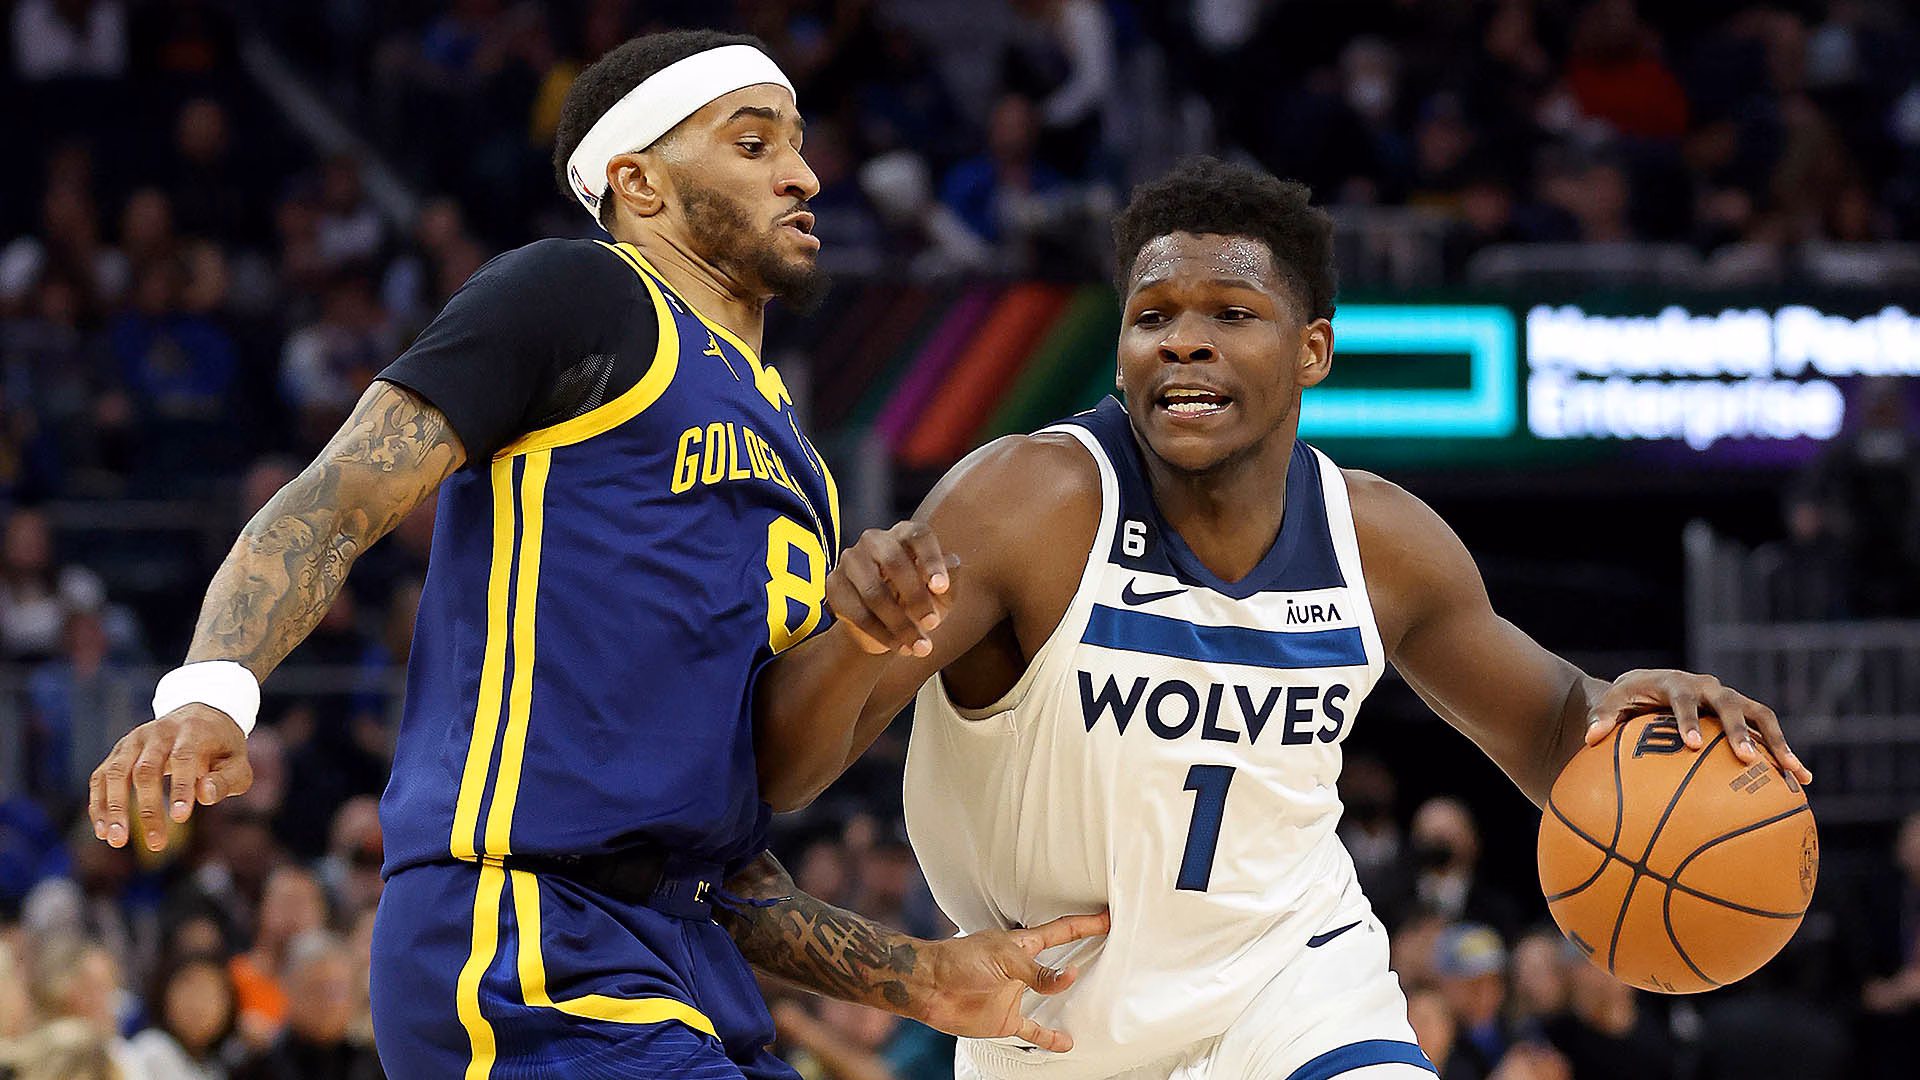
Anthony Edwards remains the unquestioned centerpiece of the Timberwolves’ identity in 2026.
In Game 1 alone he dropped 32 points on 65.0% shooting with 11 rebounds for a double-double. His 4-of-7 three-point shooting and 75.0% true shooting percentage were among the best numbers of his season. The issue in Game 1 was not Edwards — it was 26 turnovers from his teammates that handed the Warriors 25 easy points.
When Edwards is operating at that level, Minnesota is virtually impossible to stop. In any future playoff series between these clubs, Ant’s ability to hit that 30-point ceiling consistently is the X-factor that determines the outcome.
Curry’s Game 1 performance — 26 points, 7 assists, 4 steals, 9-of-9 free throws — was a reminder that he remains one of the most dangerous players in the NBA.
His 4 steals epitomized what made the Warriors so difficult to handle in Game 1. Curry doesn’t just score — he creates turnovers, pushes pace, and converts defensive miscues into three-point attempts before opponents can get set. With bench contributors like Moody and Podziemski providing secondary firepower, the Warriors are one of the most complete teams in the Western Conference when Curry is playing at this level.
One of the biggest storylines from this series was Minnesota’s bench volatility.
In Game 1, the Timberwolves’ bench scored just 13 points. In Game 2, that same group exploded for 44 — a 31-point swing. Bones Hyland led that reversal with 17 points, 5 assists, and 9 fast break points. Naz Reid swung from 0 points in Game 1 to 15 points with a +30 plus/minus in Game 2.
The bench’s consistency will be the defining factor in whether Minnesota can make a deep 2026 playoff run. When they show up, the Timberwolves are one of the West’s most dangerous teams.
Golden State’s bench scored 42 points in Game 1 while Minnesota’s bench managed just 13.
That 29-point bench advantage was arguably the single biggest factor in the Warriors’ win. Santos, Richard, and Post all contributed meaningfully off the pine. In Game 2, however, the Warriors’ bench dropped to 27 while Minnesota’s reserves erupted. That inconsistency from the Golden State second unit is a vulnerability playoff opponents will target repeatedly.
The turnover comparison across both games is the most revealing stat thread in the entire series.
| Game | MIN TOs | GSW TOs | MIN Pts Off TOs | GSW Pts Off TOs |
|---|---|---|---|---|
| Game 1 | 26 | 12 | 13 | 25 |
| Game 2 | 22 | 19 | 23 | 19 |
Minnesota’s 26 turnovers in Game 1 directly generated 25 Golden State points. When the Wolves cleaned it up to 22 in Game 2 while forcing 19 from GSW, their superior shooting and transition game took over completely.
Ball control is the deciding factor every single time these two teams face off.
Both teams enter March 2026 in contrasting playoff positions in the Western Conference.
| Team | Record | Win % | Conference Rank |
|---|---|---|---|
| Minnesota Timberwolves | 40–23 | .635 | 4th West |
| Golden State Warriors | 32–30 | .516 | 7th West |
Minnesota sits 4th in the West with genuine top-seed aspirations. Golden State is 7th and in play-in danger — making every remaining game critical. Their March 14 rematch at Chase Center is one of the most important regular season games on both schedules.
Ball control will be the biggest storyline again. Minnesota’s 26 turnovers in Game 1 were catastrophic. Getting that number into the mid-teens is a prerequisite for winning at Chase Center.
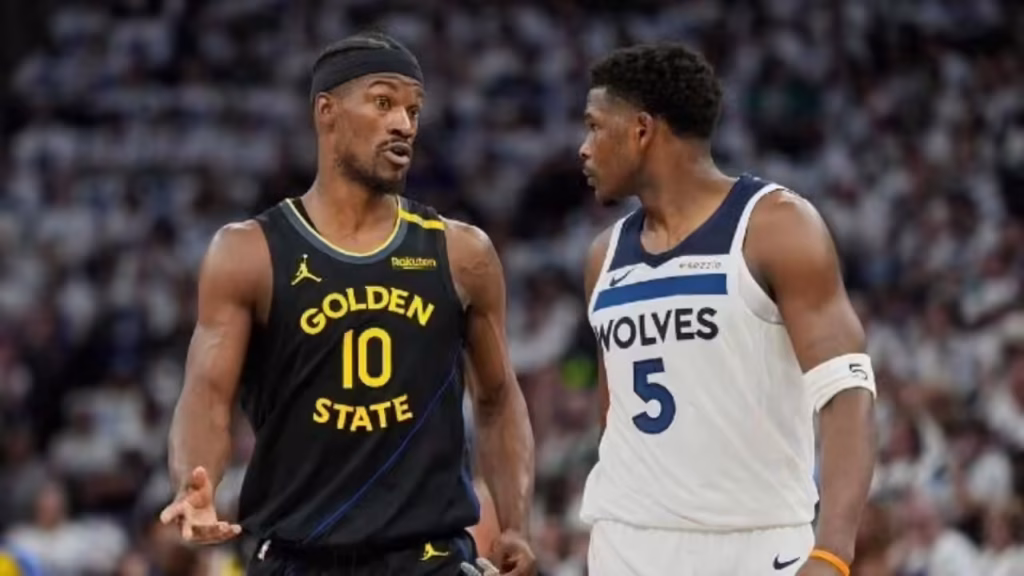
Watch Curry vs Edwards. Both are 30-point capable on any given night. Whichever star performs at higher efficiency will likely determine who wins Game 3 of this series.
Watch the bench depth battle. Golden State’s 42-point bench in Game 1 showed their reserves can win games independently. Minnesota needs Hyland and Reid to replicate their Game 2 heroics on the road.
Watch three-point shooting rates. Minnesota shot 40.0% from three in Game 2 while Golden State shot 23.1%. If those trends hold at Chase Center, the Timberwolves win going away.
The most recent game was January 27, 2026, when the Timberwolves won 108–83 at Target Center for a dominant 25-point victory.
Anthony Edwards led all scorers in Game 1 with 32 points on 65.0% shooting, while Julius Randle and Bones Hyland led Minnesota in Game 2 with 18 and 17 points respectively.
Curry posted 26 points, 7 assists, and 4 steals in Game 1 with a 59.2% true shooting percentage, earning the Warriors their 111–85 win.
Naz Reid led all players with a +30 plus/minus in Game 2, while Brandin Podziemski (+16) and Stephen Curry (+16) led the Warriors in Game 1.
Minnesota committed 26 turnovers in Game 1 and 22 in Game 2. Cutting turnovers was the key factor in their dominant Game 2 win.
Golden State recorded 20 steals in Game 1 — nearly double the league average — which generated 25 points off turnovers and powered their 26-point win.
Bones Hyland led the bench with 17 points on 66.7% shooting, 9 fast break points, 7 rebounds, and 5 assists with a +19 plus/minus.
The teams are scheduled to meet on March 14, 2026, at Chase Center in San Francisco — Golden State’s home court.
As of March 7, 2026, the Timberwolves are 40–23 (.635) ranked 4th in the West, while the Warriors are 32–30 (.516) ranked 7th in the West.
Minnesota shot 45.7% from the field and 40.0% from three, scored 29 fast break points, recorded 10 blocks, and got 44 bench points to overwhelm Golden State by 25 points.
The Timberwolves vs Golden State Warriors match player stats leaders in 2026 paint the picture of two elite but contrasting Western Conference teams.
Minnesota’s Anthony Edwards is a 32-point, double-double force capable of carrying any game, while Stephen Curry’s 26-point, 4-steal masterpiece in Game 1 reminded everyone he remains one of basketball’s most dangerous players.
The series split — Warriors by 26 in Game 1, Timberwolves by 25 in Game 2 — keeps this rivalry intensely alive heading into their March 14 rematch at Chase Center.
With playoff seeding on the line, every player stat, every turnover, and every bench contribution will matter enormously in what promises to be one of the most compelling Western Conference matchups of the entire 2026 season.