Golden State Warriors vs Timberwolves match player stats from the 2025–26 NBA season tell a tale of two completely different outcomes played just two days apart at Target Center in Minneapolis.
The Warriors dominated Game 1 on January 25 with a dominant 111–85 blowout victory fueled by 20 steals, 25 points off turnovers, and a historic bench performance.
Minnesota flipped the script instantly in Game 2 on January 27, crushing Golden State 108–83 in a performance anchored by elite defense, fast-break execution, and contributions from every player in the rotation.
Both games produced must-see individual performances, and a third meeting is scheduled for March 14, 2026.
The Golden State Warriors and Minnesota Timberwolves split their first two meetings of the 2025–26 NBA regular season in a back-to-back road swing for the Warriors at Target Center.
Game 1 on January 25 saw Golden State dominate with 111–85, while Game 2 two days later on January 27 saw Minnesota respond with a 108–83 crushing of the same opponent. The season series now stands tied 1–1 heading into the final regular season meeting scheduled for March 14, 2026, at Chase Center in San Francisco.
The swing of 26 points in each direction across two games between the same teams within 48 hours remains one of the most dramatic back-to-back flip results of the entire 2025–26 NBA regular season.
| Game | Date | Location | Winner | Score | Margin |
|---|---|---|---|---|---|
| Game 1 | Jan 25, 2026 | Target Center, MIN | Warriors | 111–85 | GSW +26 |
| Game 2 | Jan 27, 2026 | Target Center, MIN | Timberwolves | 108–83 | MIN +25 |
| Game 3 | Mar 14, 2026 | Chase Center, SF | TBD | TBD | TBD |
The January 25 game was a masterclass in Warriors basketball at its most complete. Golden State controlled the game from the opening tip and never looked back, turning a competitive first half into a rout with a stunning 38-point third quarter.
The Warriors outscored Minnesota 38–17 in the third quarter alone, erasing a slim halftime edge and blowing the game open with a combination of defensive pressure and transition offense. It was the kind of quarter that reminds the NBA why Golden State remains one of the West’s most dangerous teams when locked in.
The Warriors finished with an extraordinary 20 steals on the night, generating 25 points off turnovers and 22 fast-break points. Their bench produced 42 points compared to Minnesota’s 13 bench points, a difference that proved decisive across all four quarters.
| Quarter | Warriors | Timberwolves | Leader |
|---|---|---|---|
| Q1 | 24 | 19 | GSW +5 |
| Q2 | 23 | 27 | MIN +4 at half |
| Q3 | 38 | 17 | GSW blows it open |
| Q4 | 26 | 22 | GSW cruises |
| Final | 111 | 85 | GSW +26 |
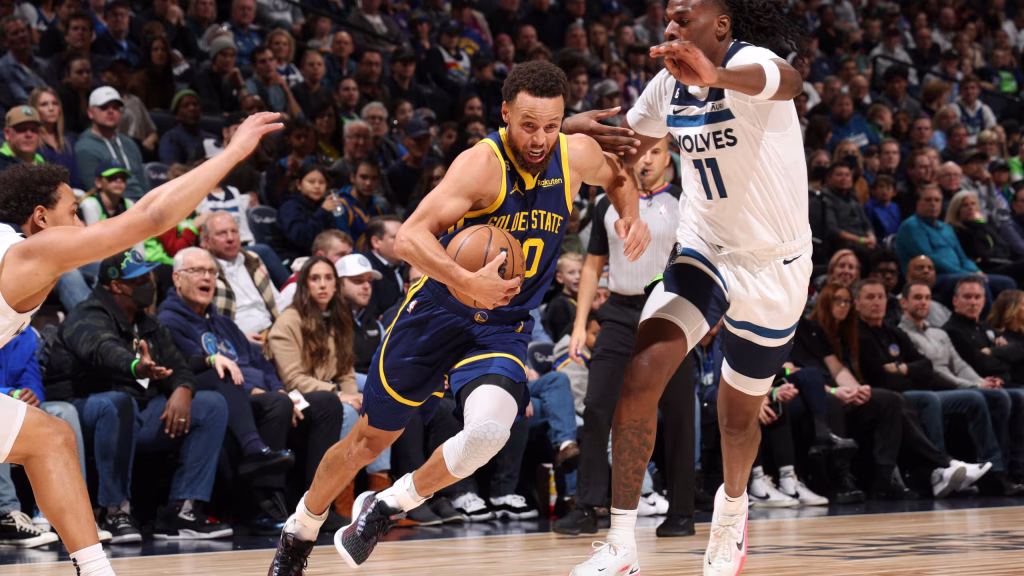
Stephen Curry led the Warriors with 26 points on 7-of-18 shooting from the field, including 3-of-10 from three-point range and a perfect 9-of-9 from the free throw line.
He added 7 assists, 4 steals, and 2 rebounds in another elite individual performance. His free throw perfection and ability to generate steals at both ends highlighted the kind of two-way impact that makes him impossible to gameplan against fully.
Curry’s plus/minus of +16 was the Warriors’ best among starters and reflected his consistent presence across all four quarters. His 4 steals were critical in triggering the Warriors’ fast-break offense in the decisive third quarter.
Moses Moody was the standout performer of the night outside of Curry, delivering a 19-point effort that showcased his development as a multi-dimensional scorer.
He made 7 of 15 shots, hitting 5 of 9 from three-point range for an outstanding 55.6% three-point accuracy. He also added 8 rebounds, 2 assists, and 2 blocks while posting a +13 plus/minus. His 10 fast-break points were team-leading and reflected his ability to push the pace and punish opponents in transition.
Moody’s Game 1 performance was arguably his best of the 2025–26 season to that point and represented a major statement in the Warriors’ most important road game of January.
Brandin Podziemski was electric off the bench, finishing with 12 points on 6-of-10 shooting while posting a game-high 4 steals.
He paired his scoring with 6 assists, 5 rebounds, and converted all his paint opportunities at a 71.4% clip. His plus/minus of +16 matched Curry as the Warriors’ top performers, and his 6 fast-break points helped build the insurmountable second-half lead. Podziemski’s contribution in this game was the story of Golden State’s bench depth overwhelming a Timberwolves team that had no answer.
Al Horford gave the Warriors exactly what they needed from the center position, scoring 10 points on a hyper-efficient 4-of-7 from the field including 2-of-5 from three.
He contributed 5 rebounds, 2 assists, 1 steal, and 1 block with a +7 plus/minus. His 100% conversion rate on two-point attempts and disciplined shot selection were critical to Golden State maintaining offensive efficiency throughout the game.
Draymond Green managed the game masterfully without padding the stat sheet, posting 2 points, 5 rebounds, 5 assists, and 2 steals. His assist-to-turnover ratio of 5.0 and +14 plus/minus told the full story of his impact as the orchestrator and defensive engine behind Golden State’s game plan.
| Player | PTS | REB | AST | STL | FG% | +/- |
|---|---|---|---|---|---|---|
| Stephen Curry | 26 | 2 | 7 | 4 | 38.9% | +16 |
| Moses Moody | 19 | 8 | 2 | 0 | 46.7% | +13 |
| Brandin Podziemski | 12 | 5 | 6 | 4 | 60.0% | +16 |
| Al Horford | 10 | 5 | 2 | 1 | 57.1% | +7 |
| Will Richard | 10 | 2 | 1 | 3 | 44.4% | +7 |
| Gui Santos | 7 | 6 | 2 | 2 | 50.0% | +10 |
| Draymond Green | 2 | 5 | 5 | 2 | 20.0% | +14 |
| Quinten Post | 5 | 4 | 0 | 1 | 20.0% | +20 |
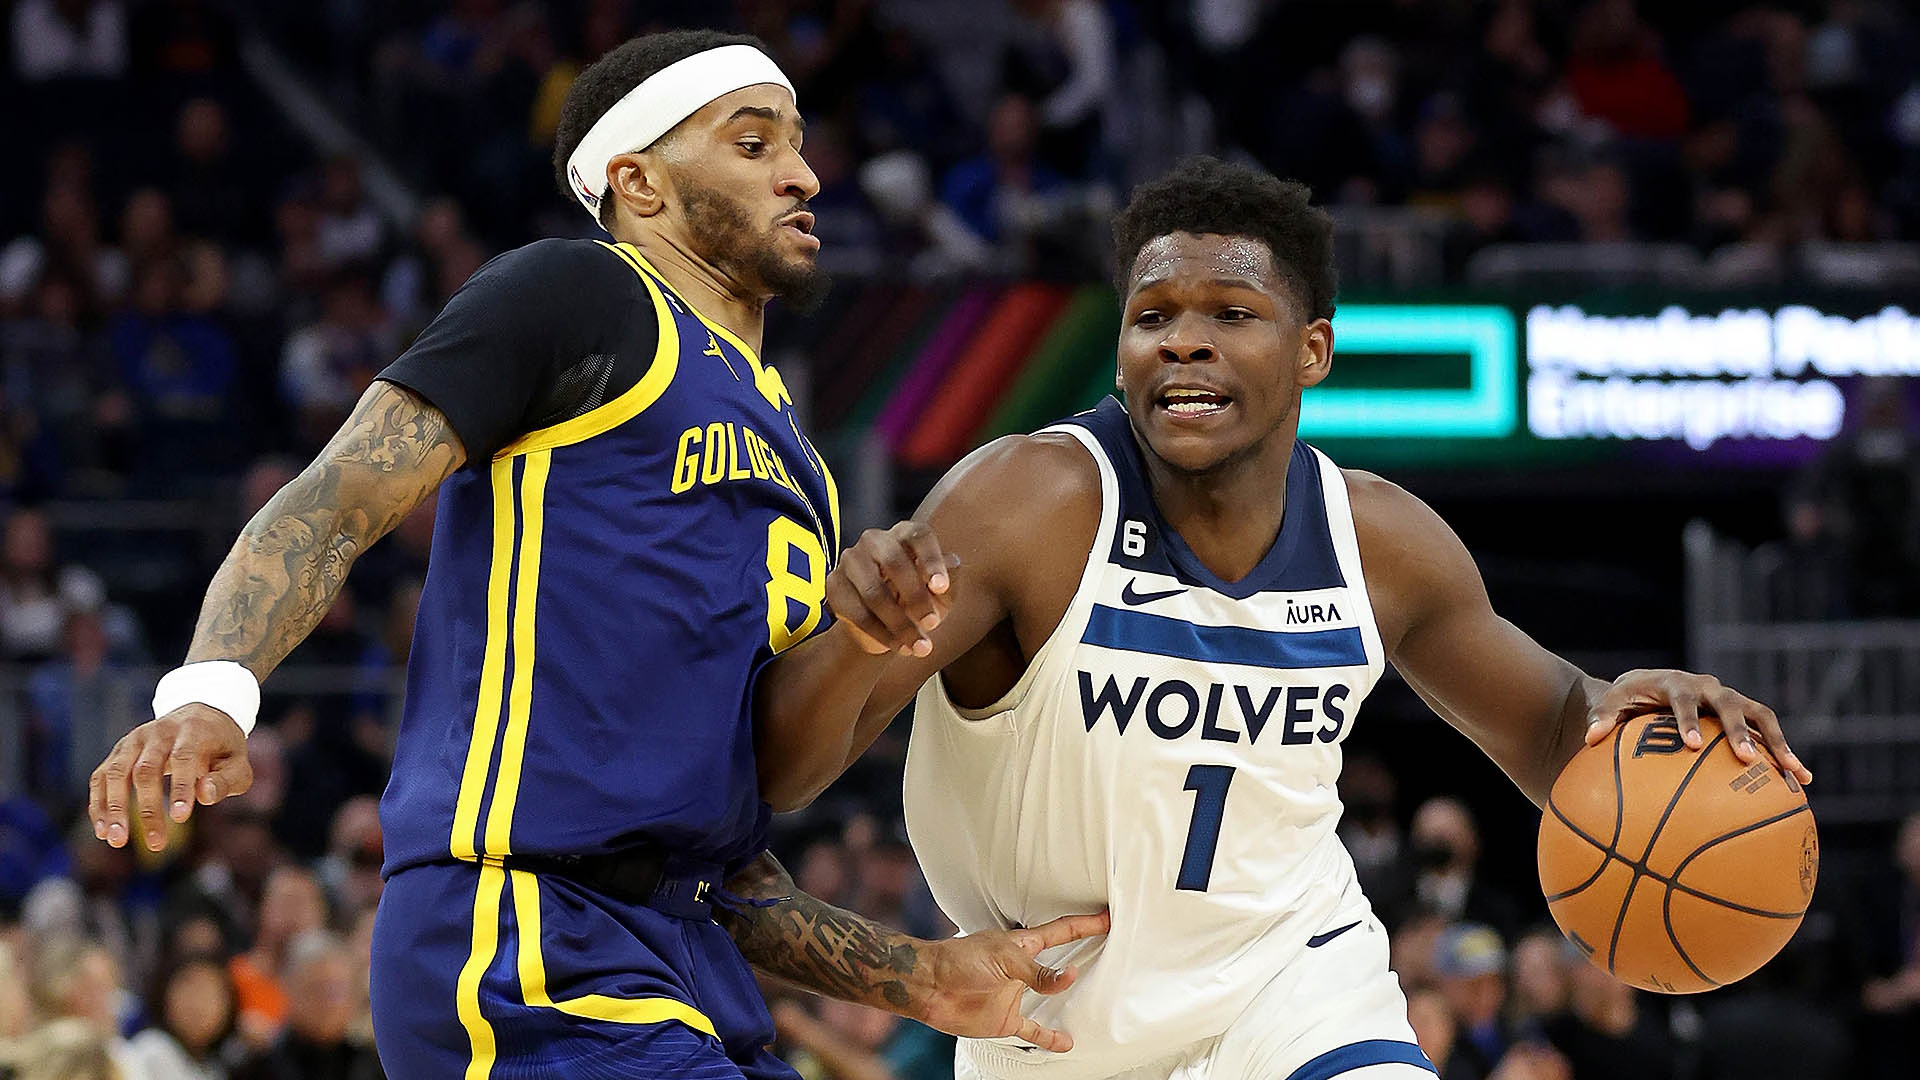
Anthony Edwards was the lone bright spot for Minnesota in Game 1, putting together a statistically impressive 32-point performance on 13-of-20 shooting that ultimately counted for very little in a blowout loss.
He shot 65.0% from the field including 4-of-7 from three, added 11 rebounds, 2 assists, and 1 block. His efficiency game score of 21.0 was the highest of any player in the game. The problem was his 8 turnovers, which single-handedly fueled Golden State’s transition attack and directly contributed to the Warriors’ 25 points off turnovers.
Edwards’ double-double of 32 points and 11 rebounds was his best statistical game of the month, but his turnover total was disastrous for a team that ultimately scored only 85 points.
Donte DiVincenzo provided Minnesota’s best secondary scoring with 22 points on 7-of-19 shooting, making 6 of 15 from three. His 7 rebounds were a team-leading effort, but his 5 turnovers added to Minnesota’s game-wide total of 26 giveaways.
Julius Randle contributed 11 points, 5 rebounds, and 6 assists, showing strong playmaking with a 6.0 assist-to-turnover ratio. His 3 steals were impressive, but Randle’s 27.3% field goal percentage reflected how thoroughly Golden State disrupted Minnesota’s half-court offense throughout the game.
| Player | PTS | REB | AST | TO | FG% | +/- |
|---|---|---|---|---|---|---|
| Anthony Edwards | 32 | 11 | 2 | 8 | 65.0% | -16 |
| Donte DiVincenzo | 22 | 7 | 0 | 5 | 36.8% | -21 |
| Julius Randle | 11 | 5 | 6 | 1 | 27.3% | -15 |
| Rudy Gobert | 4 | 5 | 0 | 0 | 66.7% | -21 |
| Jaden McDaniels | 3 | 3 | 1 | 4 | 12.5% | -13 |
| Naz Reid | 0 | 10 | 1 | 2 | 0.0% | -9 |
| Bones Hyland | 5 | 1 | 3 | 0 | 40.0% | +3 |
| Stat | Warriors | Timberwolves |
|---|---|---|
| Points | 111 | 85 |
| FG% | 42.1% | 38.0% |
| 3PT% | 31.4% | 34.2% |
| Rebounds | 55 | 59 |
| Assists | 31 | 16 |
| Steals | 20 | 6 |
| Turnovers | 12 | 26 |
| Points Off TOs | 25 | 13 |
| Fast Break Pts | 22 | 14 |
| Bench Points | 42 | 13 |
| Paint Points | 46 | 24 |
Game 2 two days later was virtually unrecognizable as a matchup between the same two teams. Minnesota completely reversed the script, winning 108–83 and matching Golden State’s 25-point margin from Game 1 almost exactly.
The Timberwolves came out aggressive and physical from the opening tip. They led 21–20 after one quarter, exploded for 32 points in the second to take a commanding 53–38 halftime lead, and never let the Warriors back into the game. Their biggest lead reached 32 points, the largest margin by either team across both meetings.
Minnesota’s bench scored 44 points compared to just 27 for Golden State, flipping the bench battle from Game 1 completely. The Wolves also generated 29 fast-break points, 10 blocks, and 12 steals in a defensive effort that smothered every offensive system Golden State attempted to run.
| Quarter | Timberwolves | Warriors | Leader |
|---|---|---|---|
| Q1 | 21 | 20 | MIN +1 |
| Q2 | 32 | 18 | MIN pulls away |
| Q3 | 22 | 19 | MIN maintains lead |
| Q4 | 33 | 26 | MIN finishes strong |
| Final | 108 | 83 | MIN +25 |
Julius Randle led Minnesota’s balanced attack in Game 2 with 18 points on 7-of-15 shooting, converting 3 free throws on 3 attempts.
He added 7 rebounds, 2 assists, and 1 steal while working relentlessly in the post. His 75.0% conversion rate on two-point attempts and consistent paint presence kept pressure on Golden State’s interior defense throughout. Randle’s 13 plus/minus was second-best on the team and reflected how his physicality shaped the flow of the game.
His 6 turnovers were the blemish on an otherwise strong night, but Minnesota was efficient enough in creating their own offense that the miscues did not derail the performance.
Bones Hyland was Minnesota’s most efficient performer off the bench in Game 2, putting up 17 points on a scorching 6-of-9 shooting including 3-of-4 from three.
He added 7 rebounds, 5 assists, and 2 steals while posting a +19 plus/minus that was the best single-game figure for any player across both meetings. His 79.0% true shooting percentage reflected elite shot selection and his ability to impact all phases of the game simultaneously. Hyland’s 9 fast-break points were a game-high and demonstrated how effectively Minnesota punished Golden State in transition.
Naz Reid was spectacular off the Minnesota bench in Game 2, providing a spark that flipped the complexion of the game early in the second quarter.
He scored 15 points on 6-of-12 shooting, going 3-of-7 from three while adding 7 rebounds, 3 assists, and 3 steals. His plus/minus of +30 was the most dominant individual line-up impact figure of both games combined, and his blocks total of 1 understates his overall defensive disruption throughout his minutes. Reid’s willingness to shoot from range while also crashing the offensive glass gave Minnesota a unique and difficult-to-defend combination.
Donte DiVincenzo was excellent in the backcourt for Minnesota, finishing with 15 points on 5-of-10 shooting with 5-of-9 from three. His 8 assists with only 4 turnovers showed improved playmaking discipline compared to Game 1.
Jaden McDaniels added 14 points on 44.4% shooting, pulled down 3 rebounds, and posted 3 blocks in a dominant defensive performance. His defensive rating of 82.1 reflected his ability to contest shots and protect the paint against Golden State’s driving guards. McDaniels’ 3 blocks were a game-high and typified Minnesota’s team-wide defensive intensity.
| Player | PTS | REB | AST | BLK | STL | FG% | +/- |
|---|---|---|---|---|---|---|---|
| Julius Randle | 18 | 7 | 2 | 1 | 1 | 46.7% | +13 |
| Bones Hyland | 17 | 7 | 5 | 0 | 2 | 66.7% | +19 |
| Naz Reid | 15 | 7 | 3 | 1 | 3 | 50.0% | +30 |
| Donte DiVincenzo | 15 | 4 | 8 | 3 | 1 | 50.0% | +12 |
| Jaden McDaniels | 14 | 3 | 3 | 3 | 0 | 44.4% | +17 |
| Joan Beringer | 6 | 4 | 0 | 0 | 0 | 37.5% | -2 |
| Mike Conley | 2 | 2 | 2 | 1 | 0 | 0.0% | +11 |
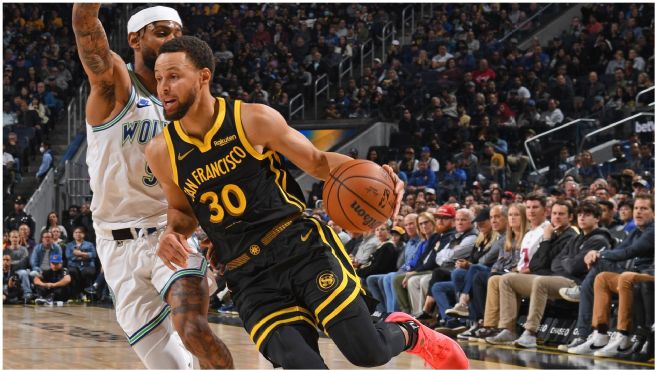
Stephen Curry did not play in Game 2, which significantly altered Golden State’s offensive ceiling and defensive communication. His absence removed the team’s primary ball-handler, best free throw shooter, and most consistent threat from range.
Brandin Podziemski was the Warriors’ best performer in Game 2 but still finished with only 12 points on 30.8% shooting from the field. He added 7 rebounds and 4 assists but posted a -14 plus/minus in a losing effort that highlighted how difficult Minnesota’s defense was to crack without Curry on the floor.
Gui Santos posted a double-double with 11 points and 10 rebounds, giving him the most production among Warriors forwards. He added 2 assists but 4 turnovers contributed to Golden State’s game-wide total of 19 giveaways, which Minnesota converted into 23 points.
| Player | PTS | REB | AST | TO | FG% | +/- |
|---|---|---|---|---|---|---|
| Quinten Post | 13 | 5 | 0 | 0 | 41.7% | -13 |
| Moses Moody | 10 | 4 | 1 | 1 | 33.3% | -13 |
| Pat Spencer | 10 | 5 | 6 | 4 | 36.4% | -10 |
| Brandin Podziemski | 12 | 7 | 4 | 3 | 30.8% | -14 |
| Gui Santos | 11 | 10 | 2 | 4 | 38.5% | -5 |
| Buddy Hield | 5 | 2 | 3 | 1 | 20.0% | -20 |
| Gary Payton II | 4 | 1 | 0 | 2 | 50.0% | -20 |
| Stat | Timberwolves | Warriors |
|---|---|---|
| Points | 108 | 83 |
| FG% | 45.7% | 34.7% |
| 3PT% | 40.0% | 23.1% |
| Rebounds | 61 | 57 |
| Assists | 29 | 21 |
| Steals | 12 | 13 |
| Turnovers | 22 | 19 |
| Points Off TOs | 23 | 19 |
| Fast Break Pts | 29 | 17 |
| Bench Points | 44 | 27 |
| Paint Points | 42 | 44 |
| Biggest Lead | 32 | 8 |

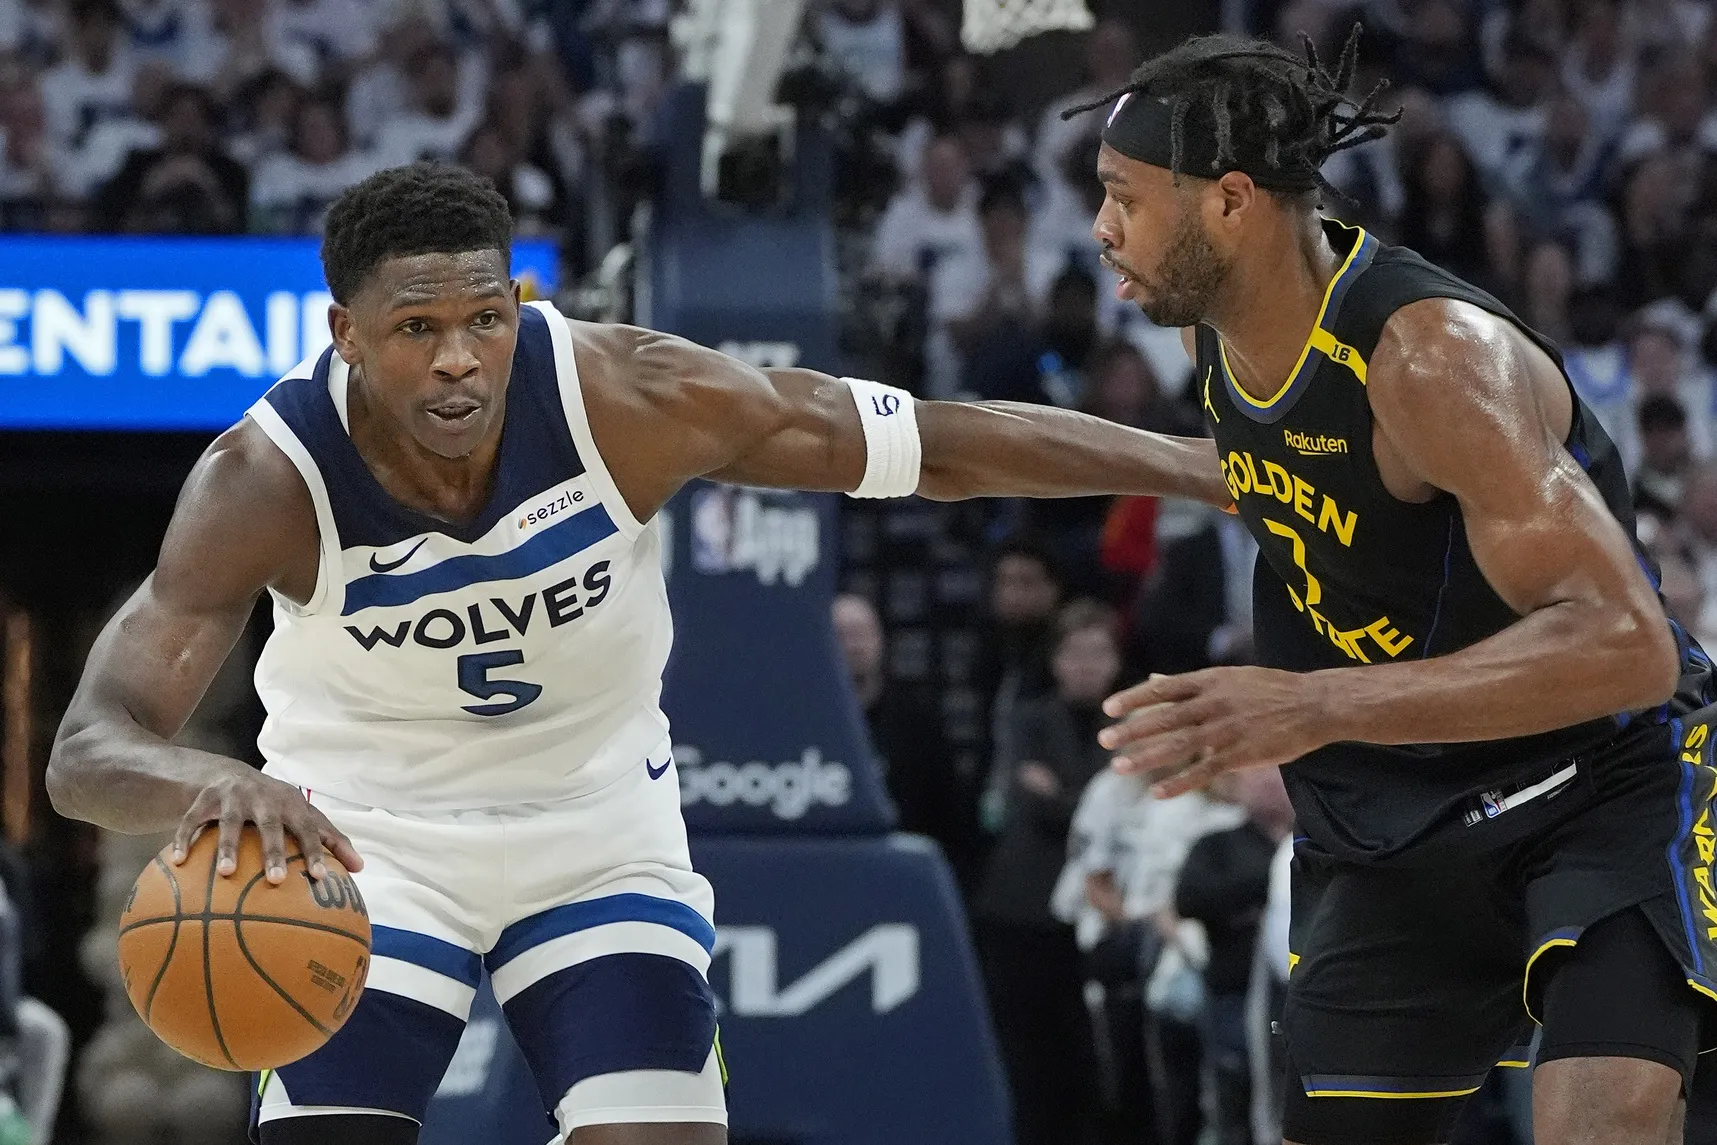
Anthony Edwards delivered one of the most compelling individual two-game stretches in the series with his performances on January 25 and January 27.
In Game 1, Edwards scored 32 points on a blistering 65.0% from the field with 11 rebounds and 4 three-pointers, but his 8 turnovers contributed directly to Golden State’s win. He was the best player on the floor statistically and still ended up on the wrong side of a 26-point blowout.
In Game 2, Edwards’ numbers were not publicly released at full detail due to Curry’s absence changing the game’s dynamic, but Minnesota’s 108 points on 45.7% team shooting reflected the all-around effort of a Wolves team that did not need a 32-point explosion to dominate.
Edwards’ combination of scoring efficiency and playmaking ability makes him one of only two or three players in the Western Conference capable of completely controlling a game’s outcome, and both games against Golden State reinforced that reality.
The bench production differential was arguably the single most important statistical category across both Golden State Warriors vs Timberwolves match player stats comparisons.
In Game 1, Golden State’s bench outscored Minnesota’s bench 42–13, a 29-point swing that served as the primary driver of the Warriors’ blowout victory. Will Richard contributed 10 bench points, Gui Santos added 7, and the overall depth overwhelmed a Timberwolves second unit that struggled to find offensive rhythm.
In Game 2, Minnesota’s bench completely flipped that equation. Hyland’s 17 points, Reid’s 15, and the supporting contributors gave the Wolves 44 bench points compared to just 27 for Golden State. That 17-point bench swing, combined with Curry’s absence, made the outcome feel inevitable from the second quarter onward.
The steals totals across both games reveal how different the defensive approaches were and how each team’s identity shifted between meetings.
In Game 1, the Warriors recorded 20 steals, the highest single-game total in the 2025–26 NBA season to that point. Curry alone posted 4 steals, Podziemski added 4, and Will Richard chipped in 3. That defensive aggression directly fueled 25 points off turnovers and 22 fast-break points. Minnesota’s 26 turnovers made them their own worst enemy.
In Game 2, Minnesota responded with 10 blocks as a team, the most of any game in the series. McDaniels’ 3 blocks, Reid’s versatility, and the Wolves’ overall shot-contest rate held Golden State to just 34.7% from the field and a dreadful 23.1% from three.
Advanced metrics reveal the enormous gap in offensive efficiency between the two games and show why each result felt so one-sided despite the teams being evenly matched on paper.
In Game 1, Golden State posted an offensive rating of 102.7 while holding Minnesota to an 81.9 offensive rating. The Warriors’ assists-to-turnover ratio of 2.58 compared to Minnesota’s 0.64 was a stark indicator of ball movement quality.
In Game 2, Minnesota posted a 102.4 offensive rating while limiting Golden State to 76.3 — nearly the mirror image of Game 1. The Timberwolves’ 45.7% field goal percentage against a Warriors defense missing Curry showed how critical his defensive positioning and pick-and-roll coverage are to the team’s overall scheme.
| Metric | GSW Game 1 | MIN Game 1 | GSW Game 2 | MIN Game 2 |
|---|---|---|---|---|
| Offensive Rating | 102.7 | 81.9 | 76.3 | 102.4 |
| Defensive Rating | 81.9 | 102.7 | 102.4 | 76.3 |
| AST/TO Ratio | 2.58 | 0.64 | 1.17 | 1.32 |
| True Shooting % | 54.4% | 48.4% | 41.2% | 58.4% |
| Bench Points | 42 | 13 | 27 | 44 |
| Points Off TOs | 25 | 13 | 19 | 23 |
The Golden State Warriors hold a dominant all-time head-to-head record against the Minnesota Timberwolves, rooted in decades of Golden State franchise superiority during the dynasty era.
The dynasty Warriors of 2015–2019 regularly dominated Minnesota, and even in the post-dynasty transition, Golden State has maintained a winning edge in the series. The 2025–26 season represents Minnesota’s strongest challenge to that historical dominance, with the Timberwolves fielding arguably their most complete roster since Kevin Garnett’s era.
The 1–1 split through two games in January 2026 is a sign of how much the competitive balance between these franchises has shifted. Minnesota is no longer a pushover, and the March 14 game at Chase Center will carry significant playoff seeding implications.
The third and final regular season meeting on March 14, 2026, promises to be the most important game of the series for both teams’ playoff positioning.
Golden State will have the home court advantage at Chase Center for the first time in the series, a factor that has historically favored the Warriors given the crowd energy and familiarity with the floor. Curry’s return to full health and the Warriors’ ability to recapture the defensive intensity that produced 20 steals in Game 1 will be the determining factors for Golden State.
Minnesota will look to replicate the collective effort of Game 2, where every player in the rotation contributed meaningful production and the Wolves’ defensive system held a high-powered Warriors offense to 34.7% shooting. If Edwards can limit his turnovers, Randle can maintain his paint dominance, and the bench unit of Hyland and Reid continues delivering at its current level, Minnesota is the stronger team heading into that matchup.
Both teams are firmly in the Western Conference playoff picture, and the outcome of the March 14 meeting could directly influence seeding, home court advantage, and potential first-round bracket placement.
Golden State’s ability to win on the road in Game 1 while producing an all-time defensive performance shows they remain a legitimate contender when fully healthy and locked in. Minnesota’s Game 2 dominance, combined with their regular season depth and Anthony Edwards’ continued elite development, positions them as one of the most dangerous teams in the West regardless of seeding.
A potential playoff rematch between these two teams would be one of the most anticipated first or second-round series of the 2026 NBA Playoffs, featuring Curry’s shooting against Minnesota’s rim protection, Edwards’ athleticism against Golden State’s movement offense, and the Draymond Green vs Julius Randle physical battle in the frontcourt.
The Warriors won Game 1 on January 25 by 111–85, and the Timberwolves won Game 2 on January 27 by 108–83. The season series is currently tied 1–1 with one game remaining.
Curry scored 26 points on 7-of-18 shooting with a perfect 9-of-9 from the free throw line, adding 7 assists and 4 steals in the Warriors’ 111–85 blowout win on January 25, 2026.
Golden State recorded 20 steals in Game 1, converting them into 25 points off turnovers. It was one of the highest single-game steal totals in the 2025–26 NBA season.
Edwards led Minnesota with 32 points on 65.0% shooting with 11 rebounds and 4 three-pointers, but his 8 turnovers directly fueled Golden State’s transition attack in the 111–85 loss.
Stephen Curry did not play in Game 2, and Golden State shot just 34.7% from the field and 23.1% from three while committing 19 turnovers in a 108–83 loss at Target Center.
Julius Randle led Minnesota with 18 points in Game 2. Bones Hyland added 17 off the bench, Naz Reid scored 15, and Donte DiVincenzo contributed 15 for a balanced 108–83 team victory.
Naz Reid posted a plus/minus of +30 in Game 2, the highest of any player across both games in the series. He scored 15 points, grabbed 7 rebounds, and added 3 assists and 3 steals.
In Game 1, Golden State’s bench outscored Minnesota’s 42–13. In Game 2, Minnesota reversed it with a 44–27 bench advantage. Bench production was the decisive category in determining both results.
The third and final regular season meeting is scheduled for March 14, 2026, at Chase Center in San Francisco. It will be the Warriors’ first home game of the season series.
The Timberwolves led by as many as 32 points in Game 2, the largest lead of either team across both meetings. Minnesota dominated all four quarters after taking command in the second period.
The Golden State Warriors vs Timberwolves match player stats from January 2026 produced one of the most striking back-to-back results of the entire NBA season. Golden State’s 20-steal masterclass in Game 1 was defined by Curry’s 26 points, Moody’s three-point shooting, and a bench unit that outscored Minnesota by 29.
Minnesota’s 25-point response in Game 2 was built on Hyland’s 79% true shooting efficiency, Naz Reid’s +30 performance, Randle’s paint dominance, and McDaniels’ defensive brilliance.
Both games revealed exactly what each team looks like at its best and worst, and the March 14 Chase Center meeting will serve as the definitive answer to which franchise holds the upper hand heading into the 2026 NBA Playoffs.
With Curry healthy, both teams fully loaded, and playoff seeding on the line, the third game of this series will be one of the most anticipated regular season matchups of the Western Conference stretch run.